KMinion Cluster Dashboard - Prometheus Exporter for Apache Kafka 381,048381,048 5.0 (1 reviews)
3/5/2021
3/5/2021
1
>=7.3.6
Prometheus
Description
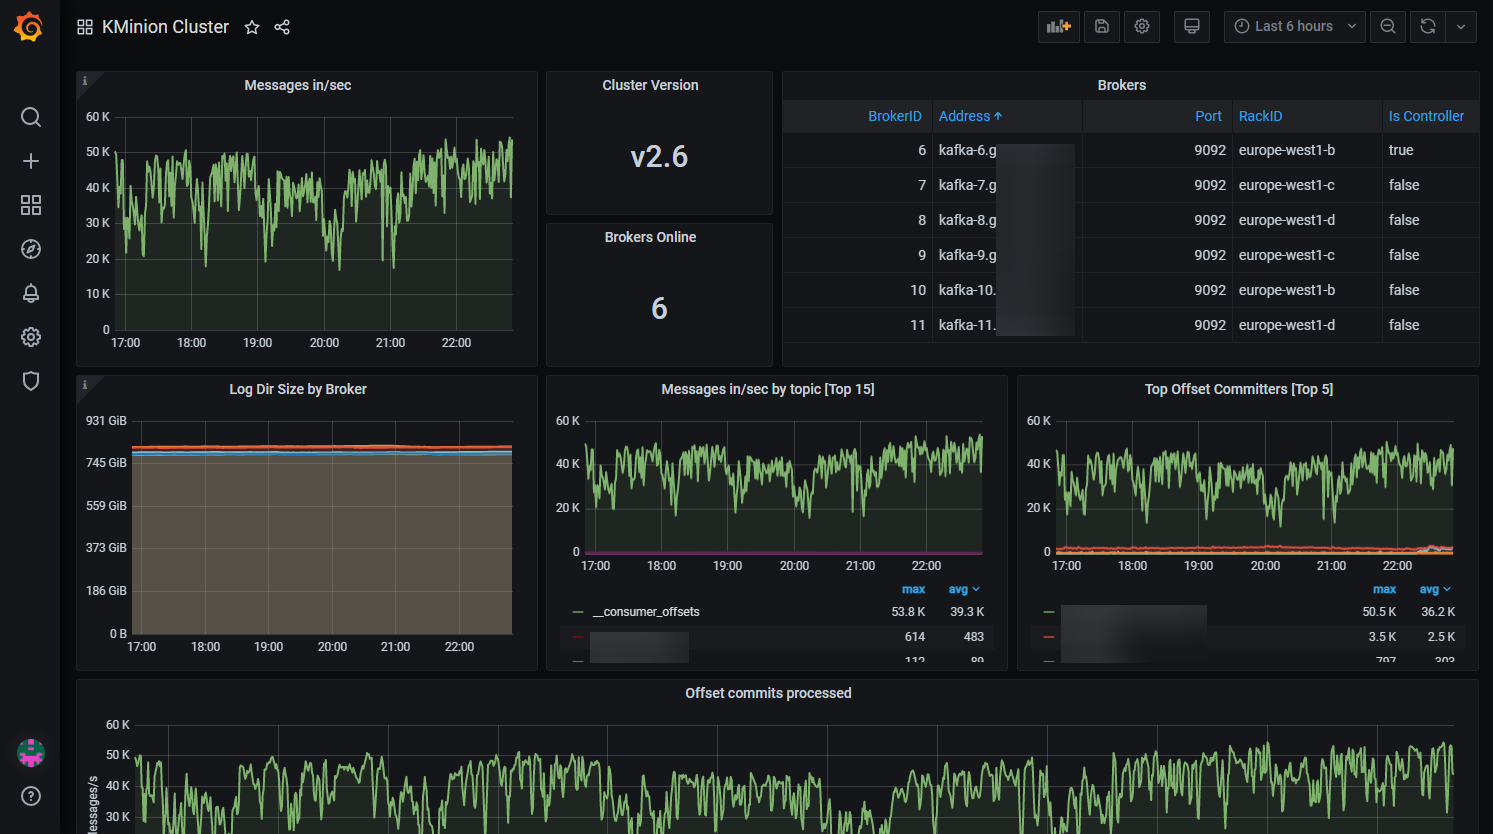
This dashboard monitors a Kafka cluster's health and activity with Prometheus-exported metrics. It highlights core metrics such as per-topic message throughput (kminion_kafka_topic_high_water_mark_sum and related topic metrics), broker status and info (kminion_kafka_cluster_info, kminion_kafka_broker_info), and log directory usage (kminion_kafka_broker_log_dir_size_total_bytes) to quickly assess throughput, broker availability, and storage trends. Key panels include Messages in/sec, Brokers Online, Log Dir Size by Broker, and Top Offset Committers, enabling rapid fault detection and performance analysis across the cluster.
Screenshots
Get Dashboard✕
Download
Copy to Clipboard