Karpenter 211,434211,434
Description
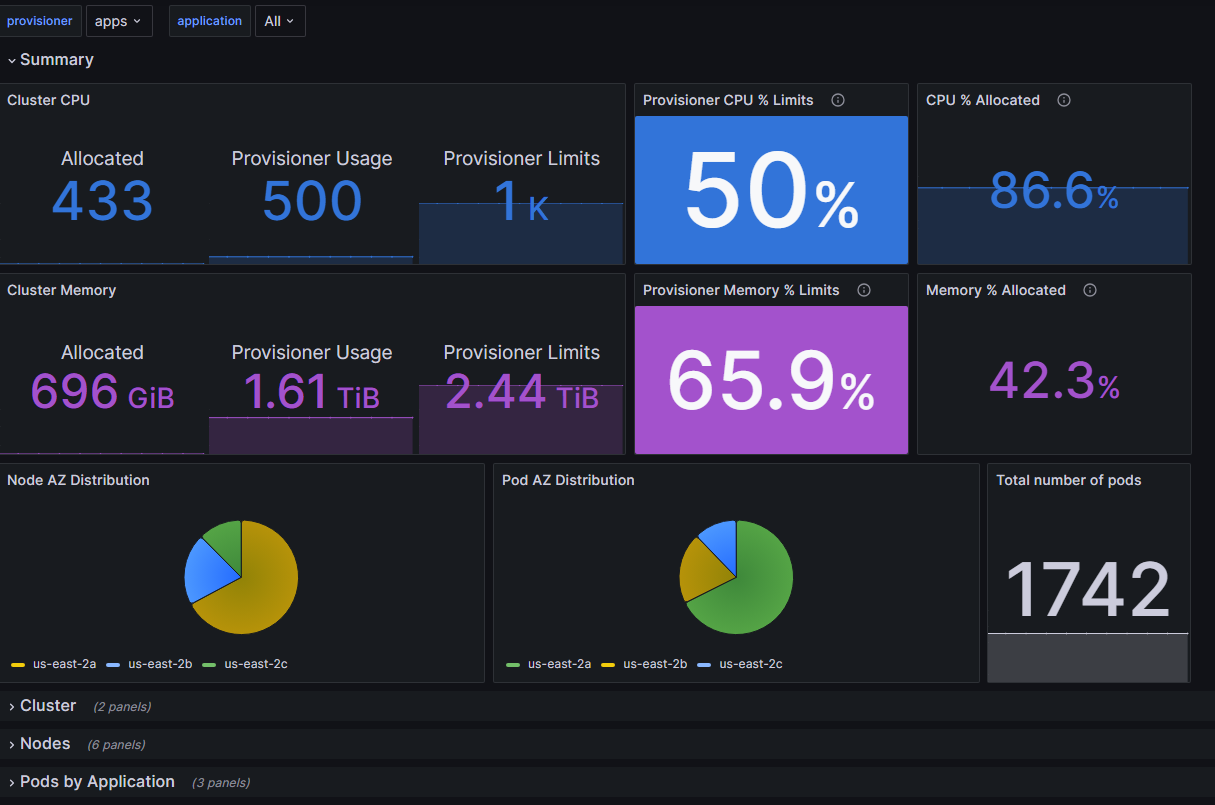
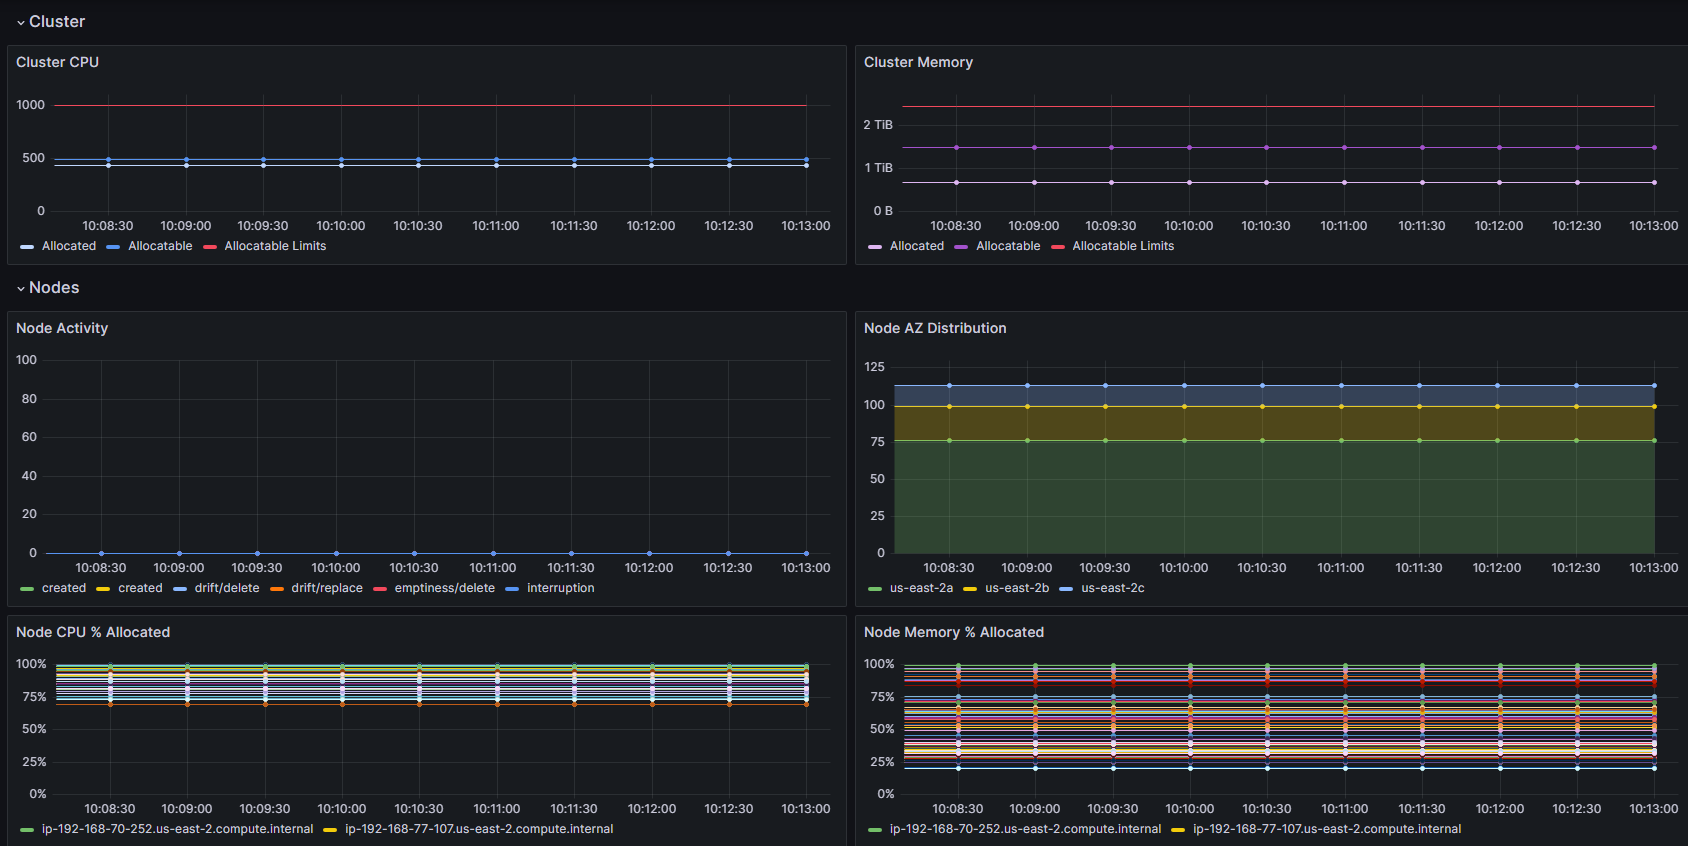
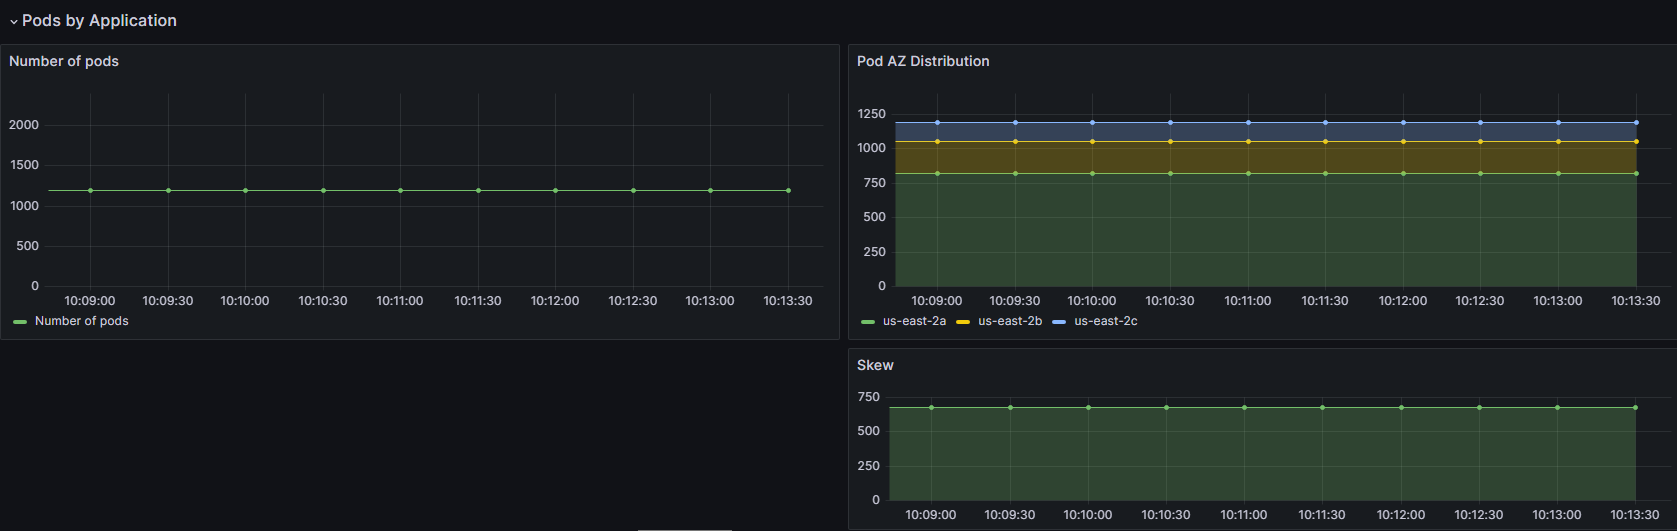
This dashboard monitors Kubernetes cluster resource usage and provisioner efficiency for Karpenter, focusing on how CPU and memory are allocated versus limits across the cluster and its provisioners. Key visualizations track karpenter_provisioner_usage against karpenter_provisioner_limit to show utilization against capacity, along with allocation efficiency metrics such as karpenter_nodes_total_pod_requests and karpenter_nodes_total_daemon_requests, which illustrate pod and daemon set demand vs. availability. It also provides distribution insights by availability zone for nodes and pods through Node AZ Distribution and Pod AZ Distribution, and tracks the total number of pods to contextualize resource pressure.
Screenshots
Used Metrics 55
karpenter_nodes_total_daemon_requests
karpenter_nodes_total_pod_requests
karpenter_pods_state
karpenter_provisioner_limit
karpenter_provisioner_usage