Kamon Akka
1,179

Created 1/24/2018
Updated 1/24/2018
Revision 1
Categories
Host Metrics
Grafana Version >=4.1.2
Datasources
Prometheus

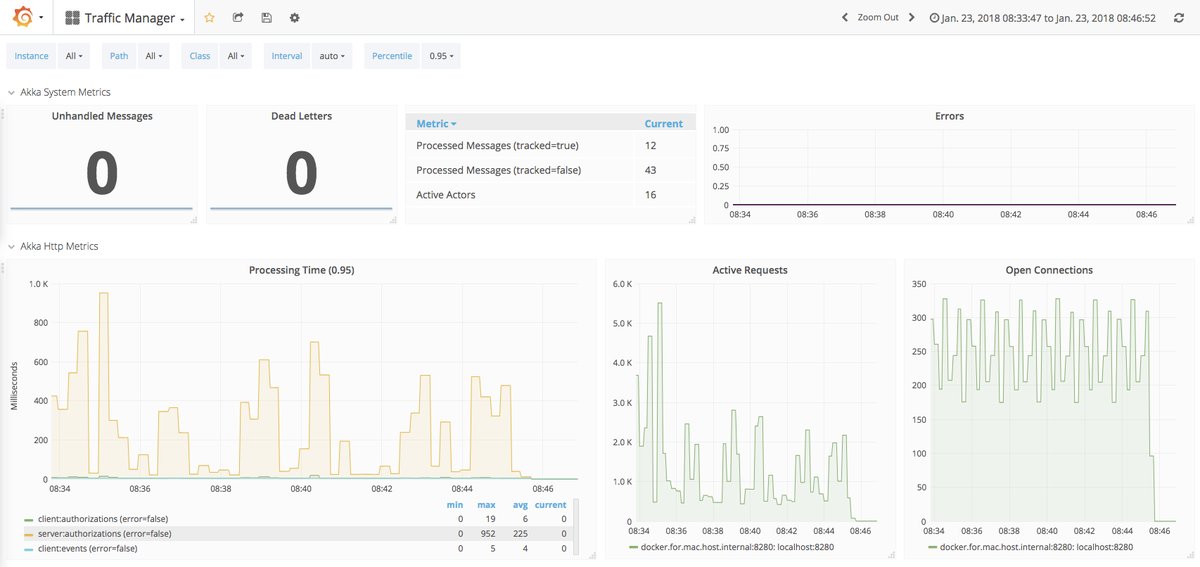
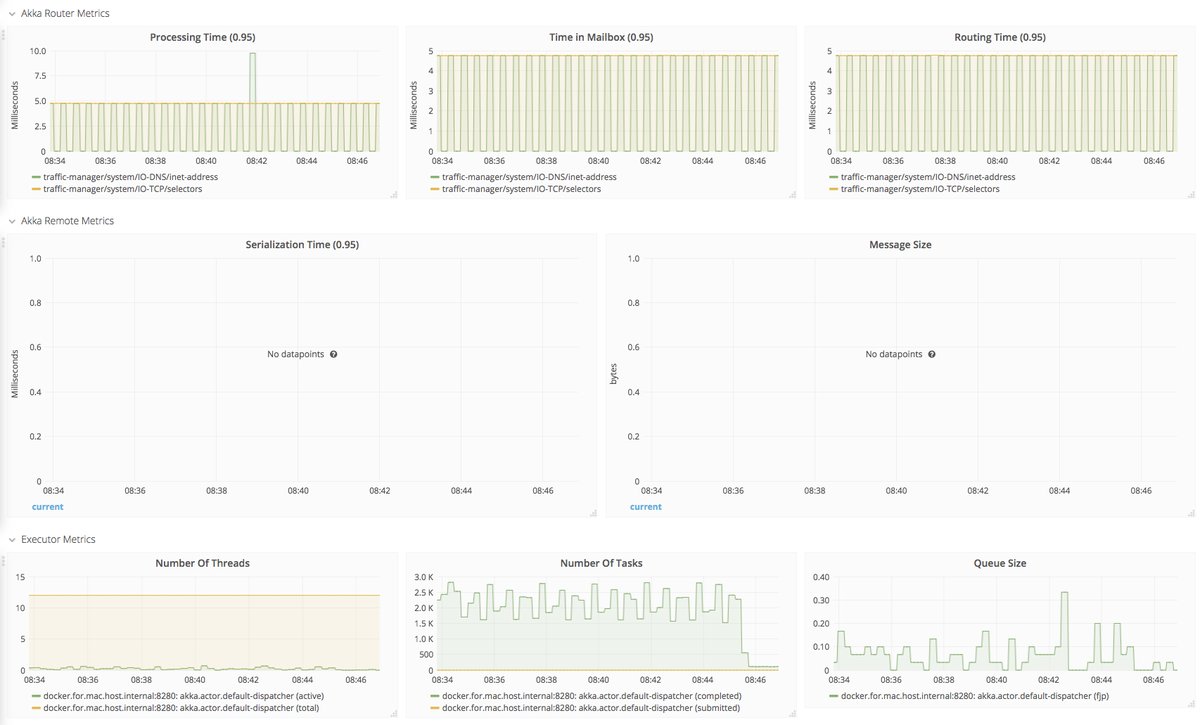
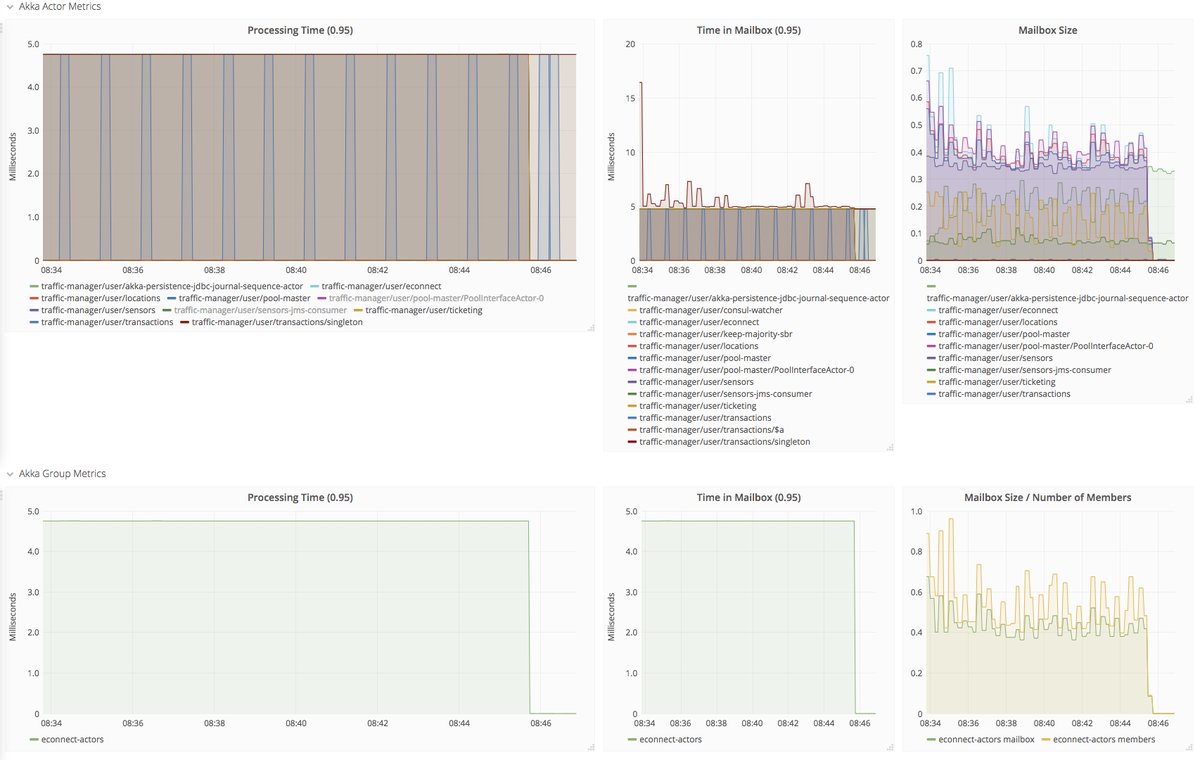
Kamon Akka Dashboard using Prometheus as Datasource.

This dashboard shows the most important metrics of an akka application. The metrics are collected by Kamon 1.x.x and scraped by Prometheus from an endpoint that can be served by the Kamon Prometheus reporter. Additional Kamon modules like Kamon Akka Remote are required for some more specific metrics. For more details, see the Kamon documentation: http://kamon.io/documentation/get-started/

If something important is missing and you like to contribute to this dashboard, visit us on Github: https://github.com/StephenKing/kamon-grafana-dashboard

Get Dashboard
Download
Copy to Clipboard
Source Grafana.com