Kamon 2.x - System metrics dashboard 138,947138,947
Description
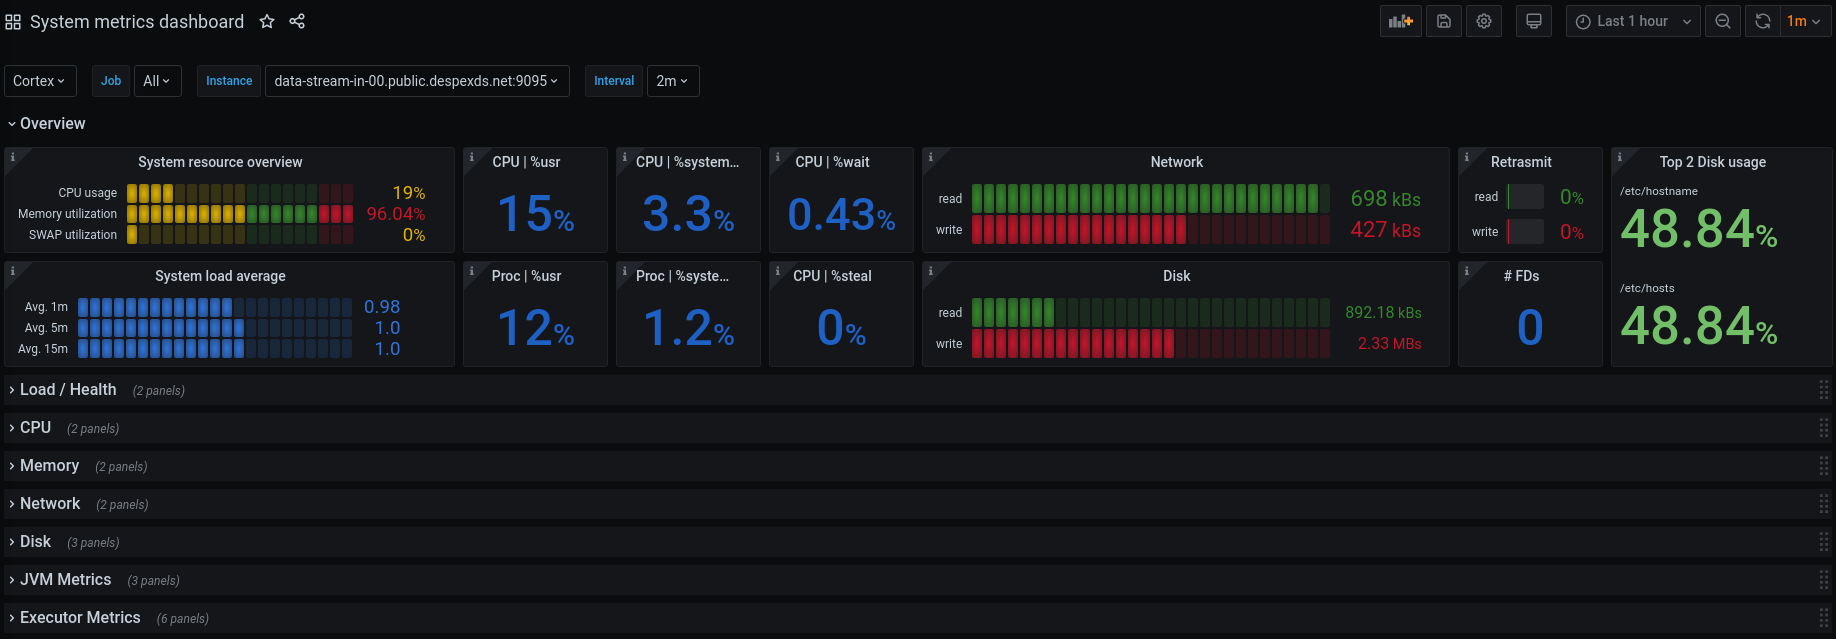
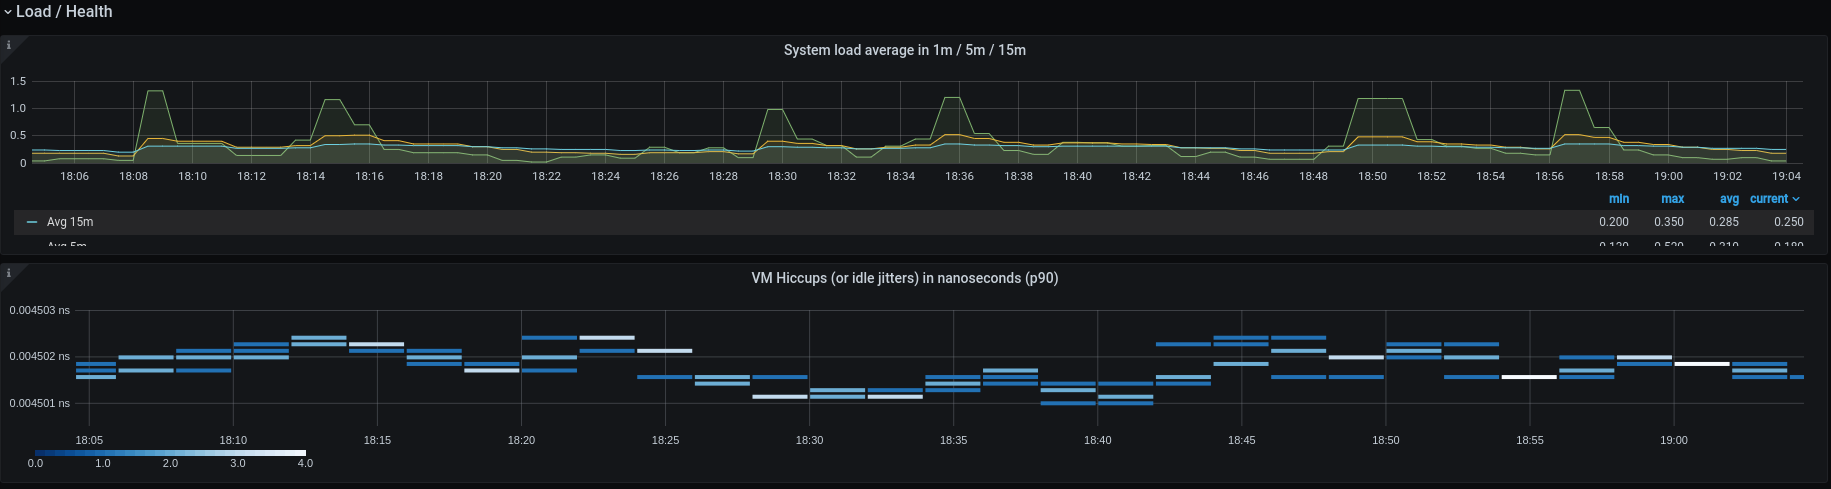
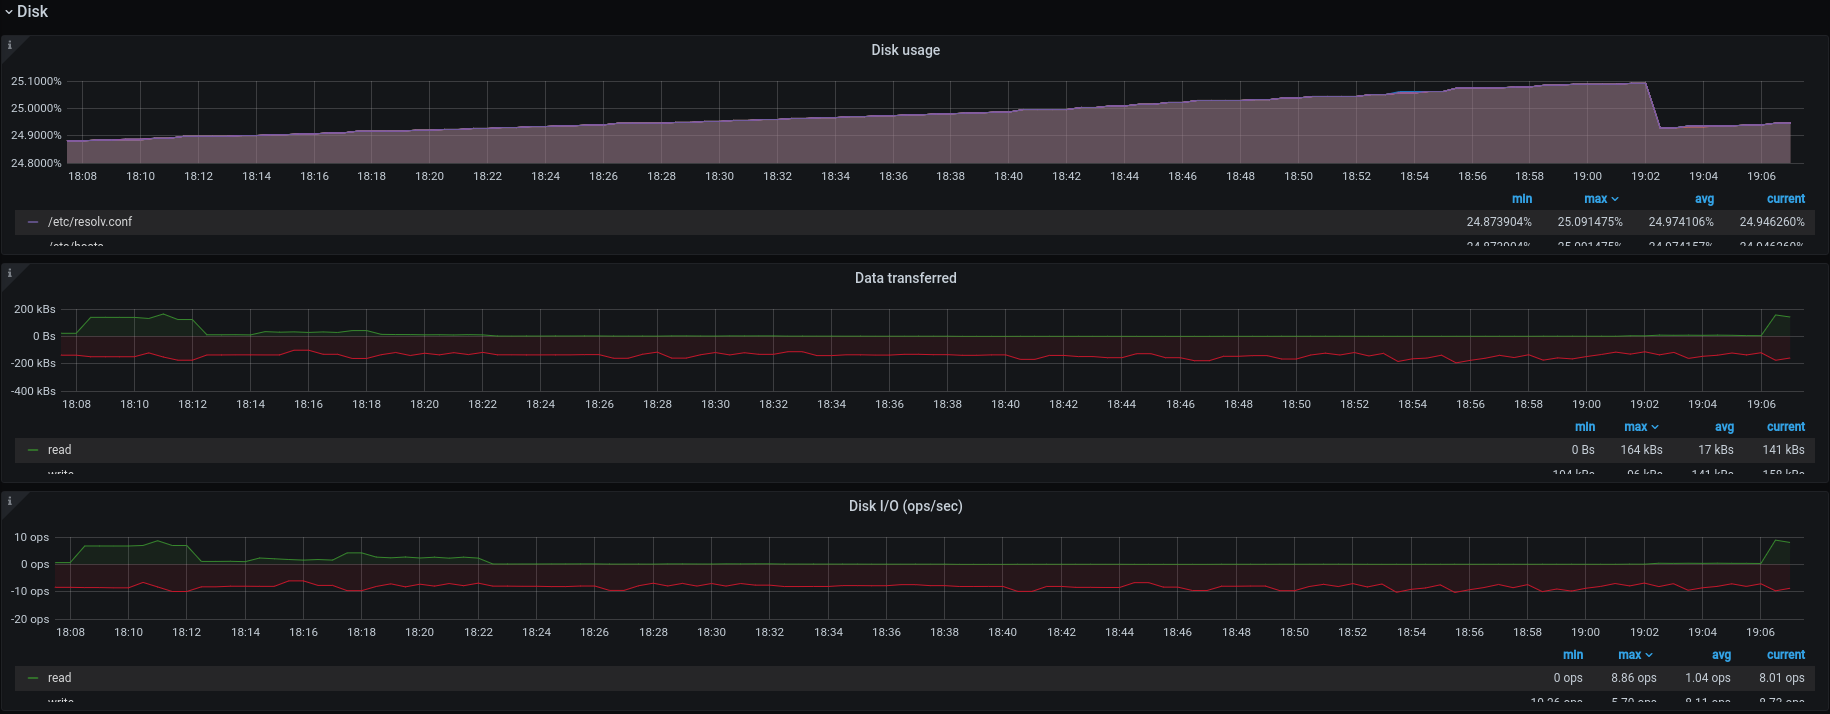
This dashboard presents a comprehensive view of system health and performance, aggregating host-level metrics such as CPU utilization, memory, disk, and network activity. It highlights both core utilization (e.g., host_cpu_usage_sum and host_memory_used_bytes) and I/O characteristics (e.g., host_network_data_read_bytes_total, host_network_data_write_bytes_total), with scenarios like load averages and process-level usage to diagnose bottlenecks. Key features include per-CPU and proc breakdowns, time-based load windows (1m/5m/15m), and visibility into memory pressure and network throughput to spot contention and latency issues.
Screenshots
Used Metrics 4040
executor_parallelism
executor_queue_size_bucket
executor_tasks_completed_total
executor_threads_max
executor_threads_min
executor_threads_total_count
executor_threads_total_sum
host_cpu_usage_count
host_cpu_usage_sum
host_load_average
host_memory_total_bytes
host_memory_used_bytes
host_network_data_read_bytes_total
host_network_data_write_bytes_total
host_network_packets_read_failed_total
host_network_packets_read_total_total
host_network_packets_write_failed_total
host_network_packets_write_total_total
host_storage_device_data_read_bytes_total
host_storage_device_data_write_bytes_total
host_storage_device_ops_read_total
host_storage_device_ops_write_total
host_storage_mount_space_total_bytes
host_storage_mount_space_used_bytes
host_swap_memory_total_bytes
host_swap_memory_used_bytes
interval
jvm_gc_seconds_count
jvm_gc_seconds_sum
jvm_memory_committed_bytes
jvm_memory_free_bytes_count
jvm_memory_free_bytes_sum
jvm_memory_max_bytes
jvm_memory_used_bytes_count
jvm_memory_used_bytes_sum
process_cpu_usage_count
process_cpu_usage_sum
process_hiccups_seconds_bucket
process_ulimit_file_descriptors_used
topk