Kafka Streams Dashboard 2,6632,663
Description
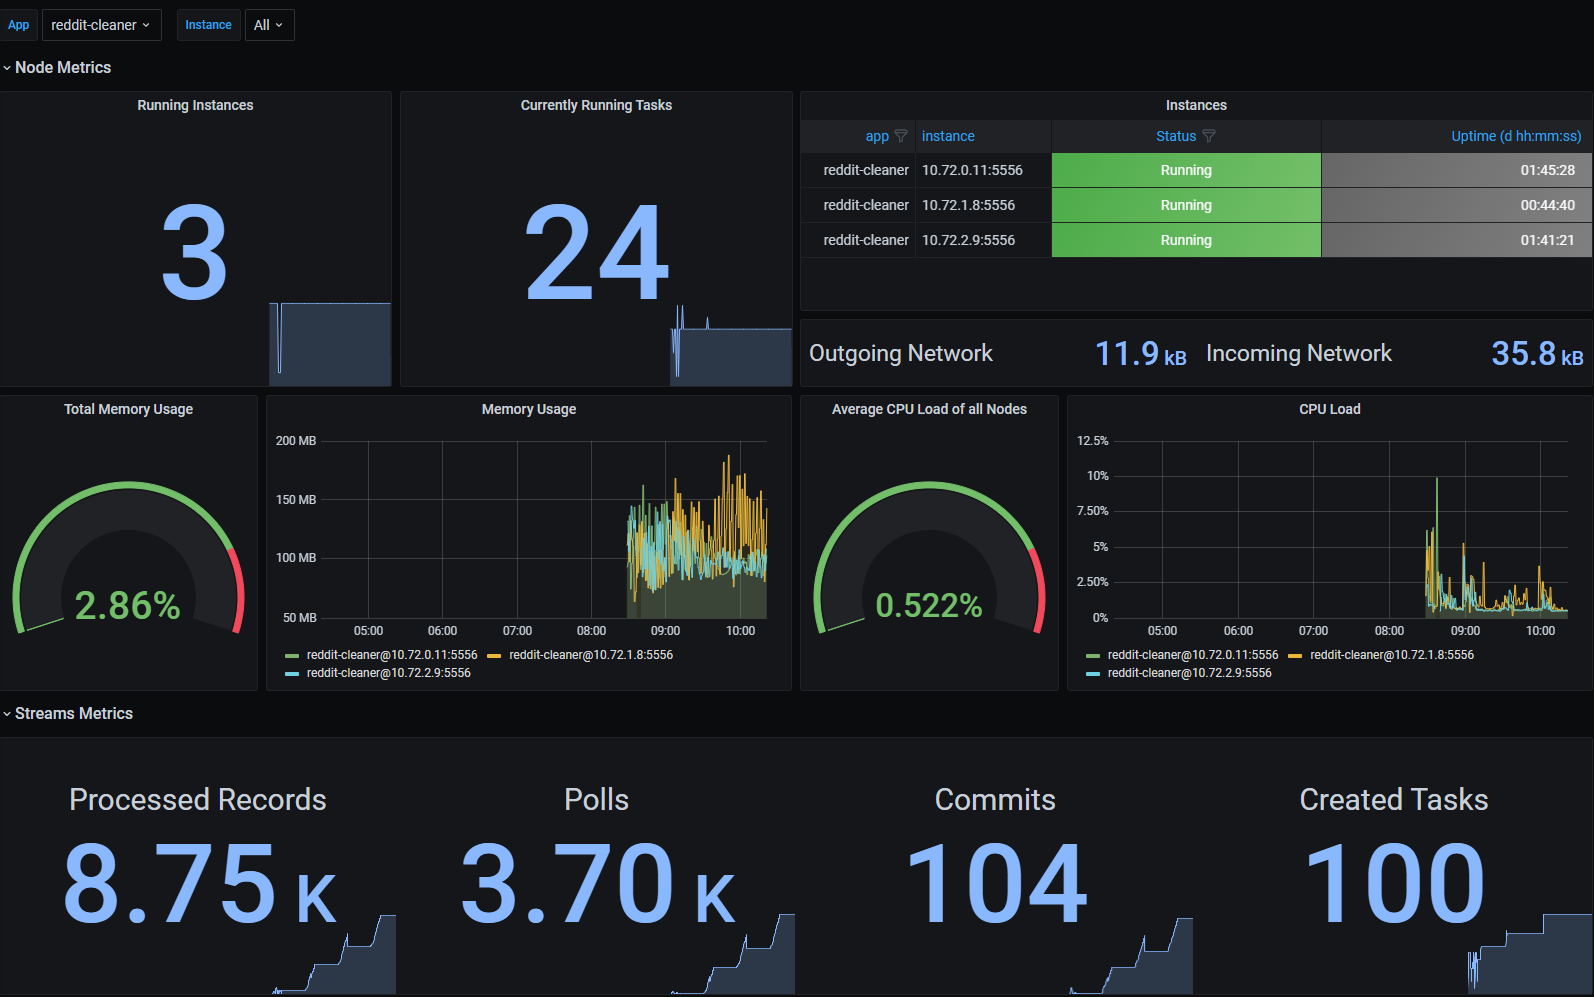
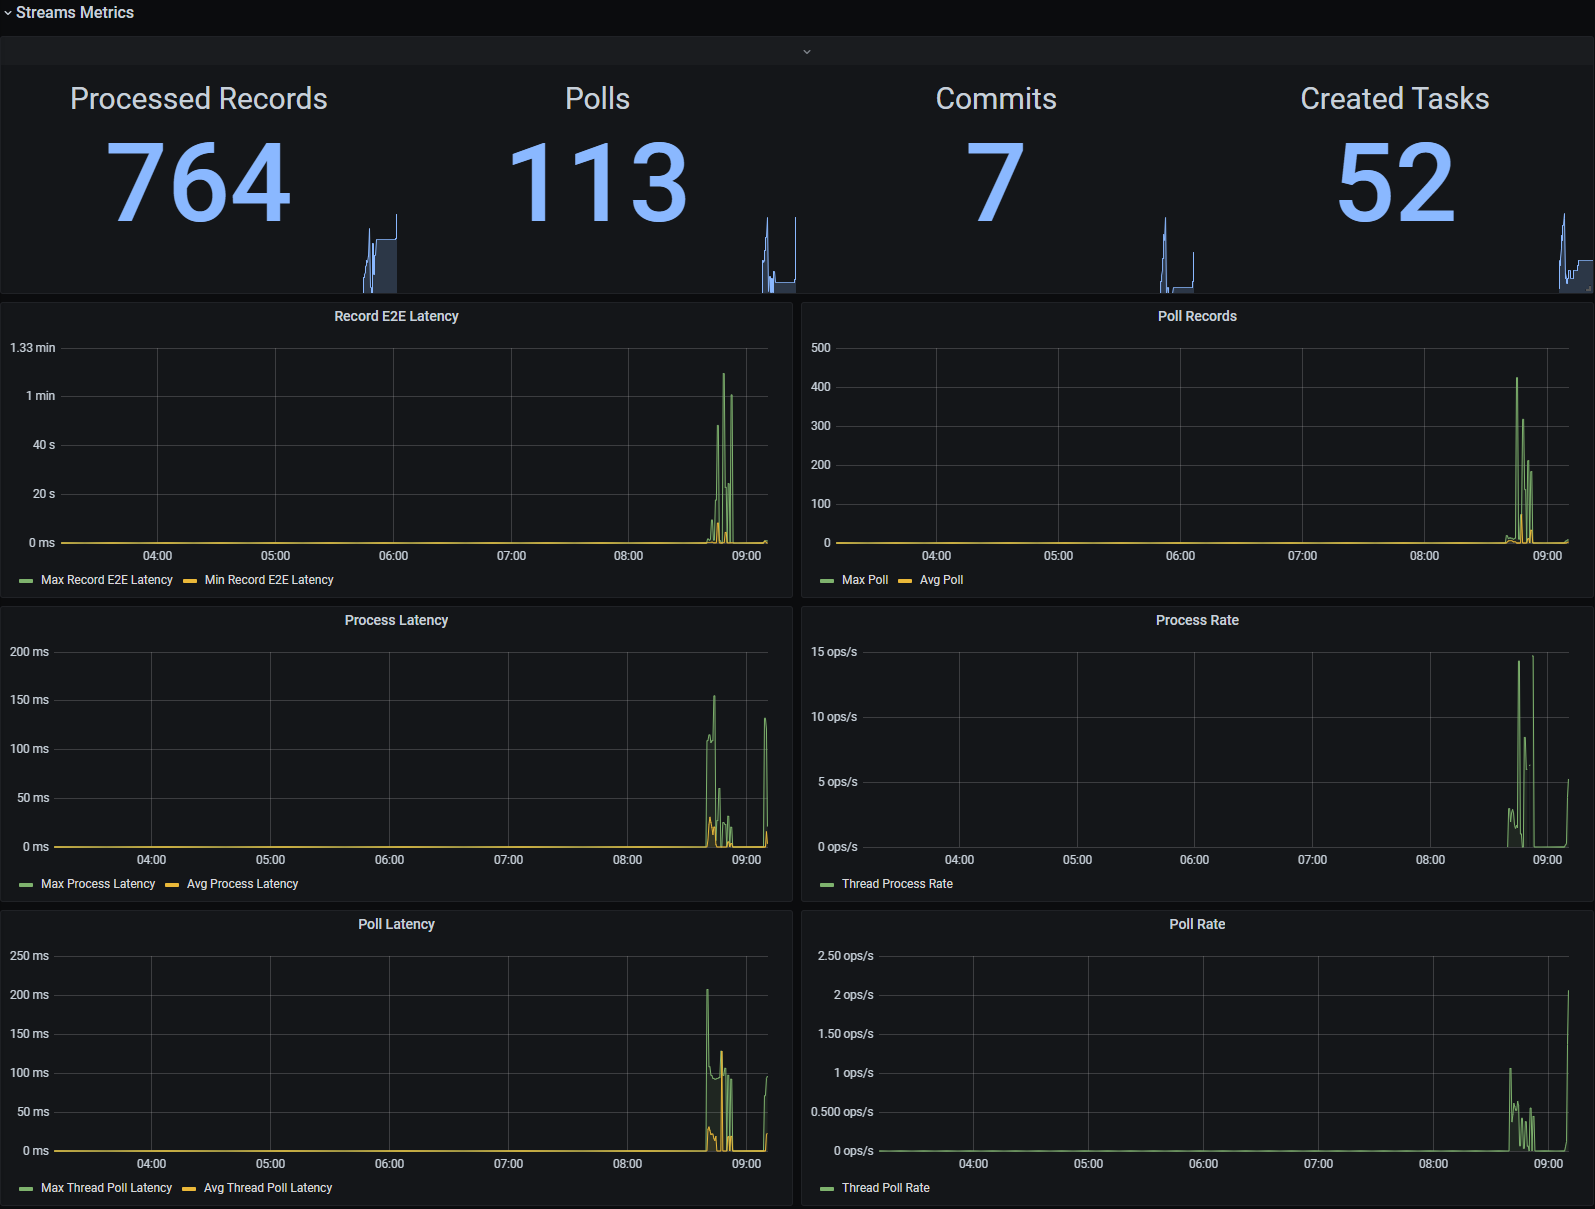
Dashboard for a Kafka Streams application using Prometheus JMX-Exporter running in Kubernetes
Screenshots
Used Metrics 2727
instance
java_lang_MemoryPool_Usage_used
java_lang_OperatingSystem_ProcessCpuLoad
java_lang_OperatingSystem_TotalPhysicalMemorySize
java_lang_Runtime_Uptime
kafka_admin_client_admin_client_metrics_incoming_byte_total
kafka_admin_client_admin_client_metrics_outgoing_byte_total
kafka_streams_kafka_metrics_count_count
kafka_streams_stream_processor_node_metrics_record_e2e_latency_max
kafka_streams_stream_processor_node_metrics_record_e2e_latency_min
kafka_streams_stream_thread_metrics_commit_latency_avg
kafka_streams_stream_thread_metrics_commit_latency_max
kafka_streams_stream_thread_metrics_commit_rate
kafka_streams_stream_thread_metrics_commit_total
kafka_streams_stream_thread_metrics_poll_latency_avg
kafka_streams_stream_thread_metrics_poll_latency_max
kafka_streams_stream_thread_metrics_poll_rate
kafka_streams_stream_thread_metrics_poll_records_avg
kafka_streams_stream_thread_metrics_poll_records_max
kafka_streams_stream_thread_metrics_poll_total
kafka_streams_stream_thread_metrics_process_latency_avg
kafka_streams_stream_thread_metrics_process_latency_max
kafka_streams_stream_thread_metrics_process_rate
kafka_streams_stream_thread_metrics_process_total
kafka_streams_stream_thread_metrics_task_closed_total
kafka_streams_stream_thread_metrics_task_created_total
kube_deployment_status_replicas_available