K8s / Storage / Volumes / Namespace 4,854,4624,854,462
Description
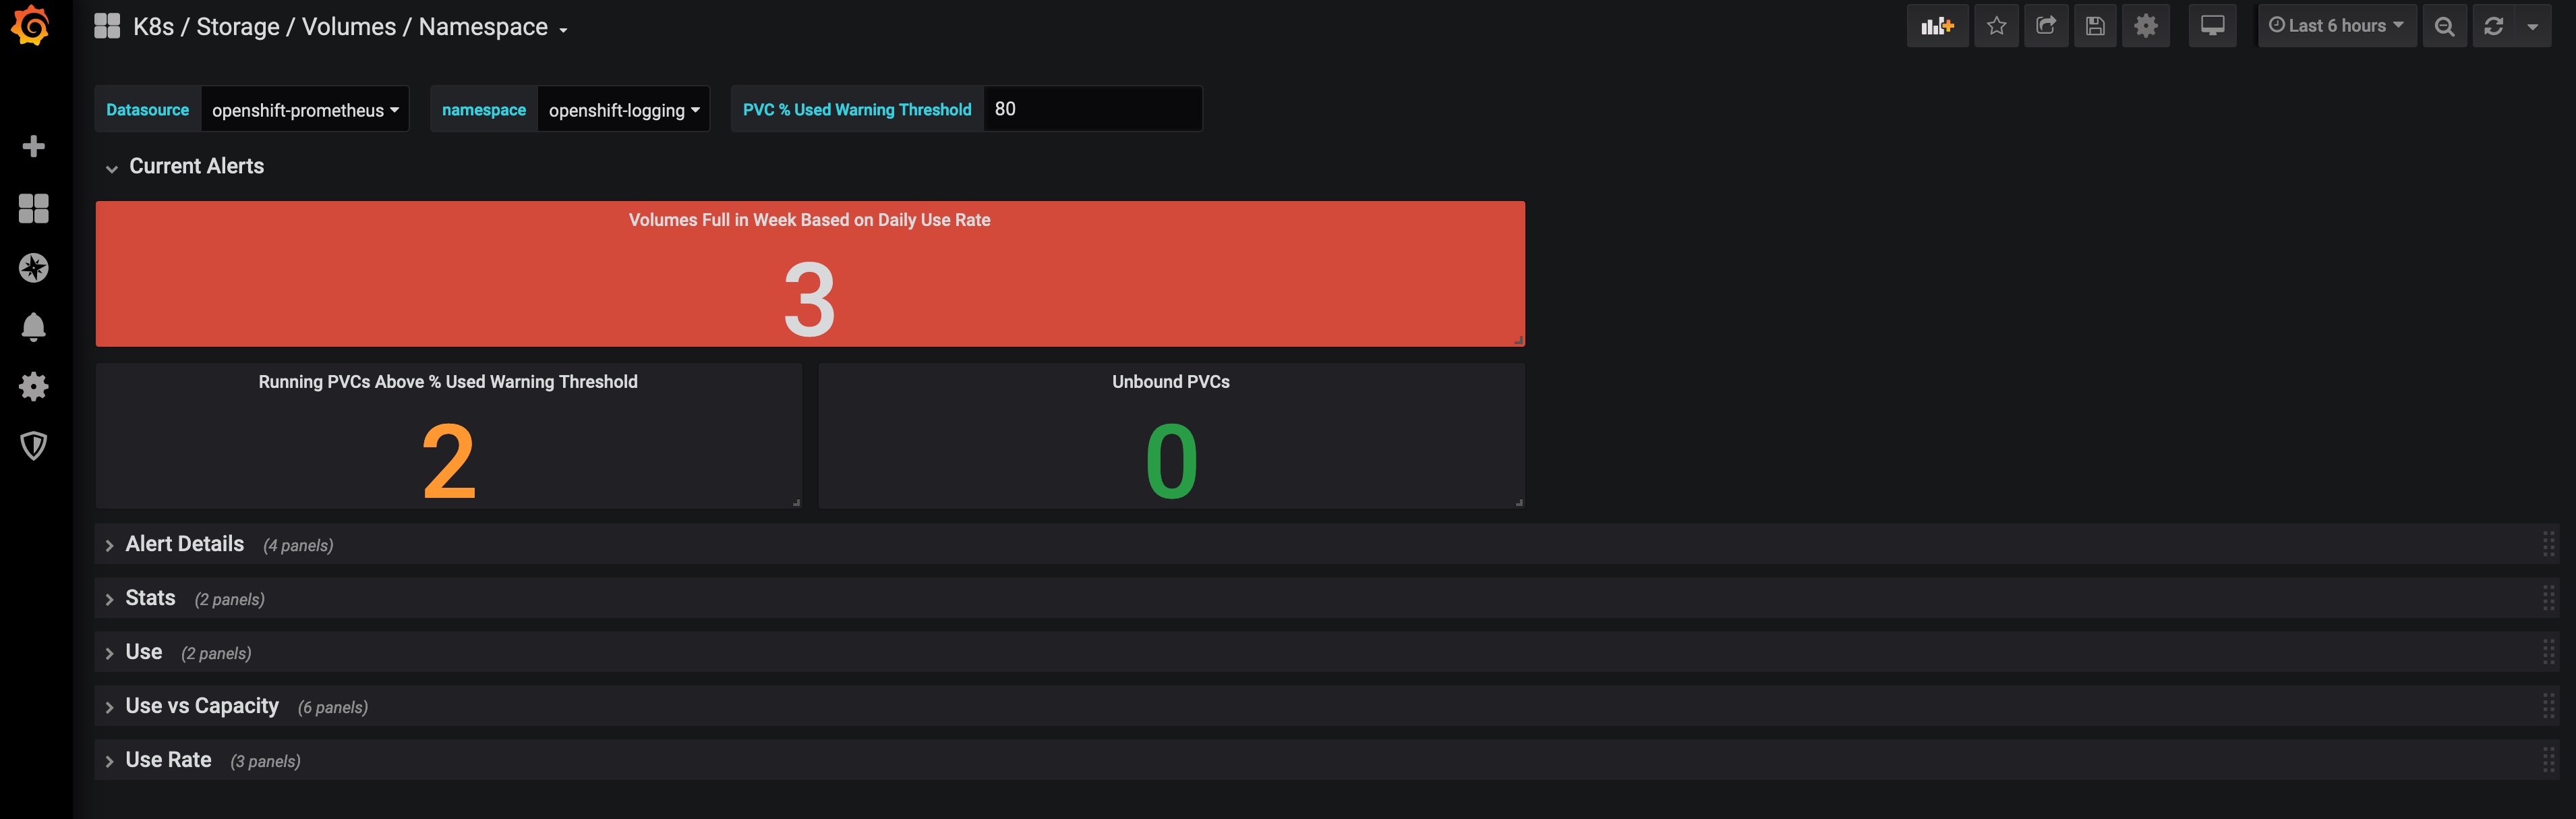
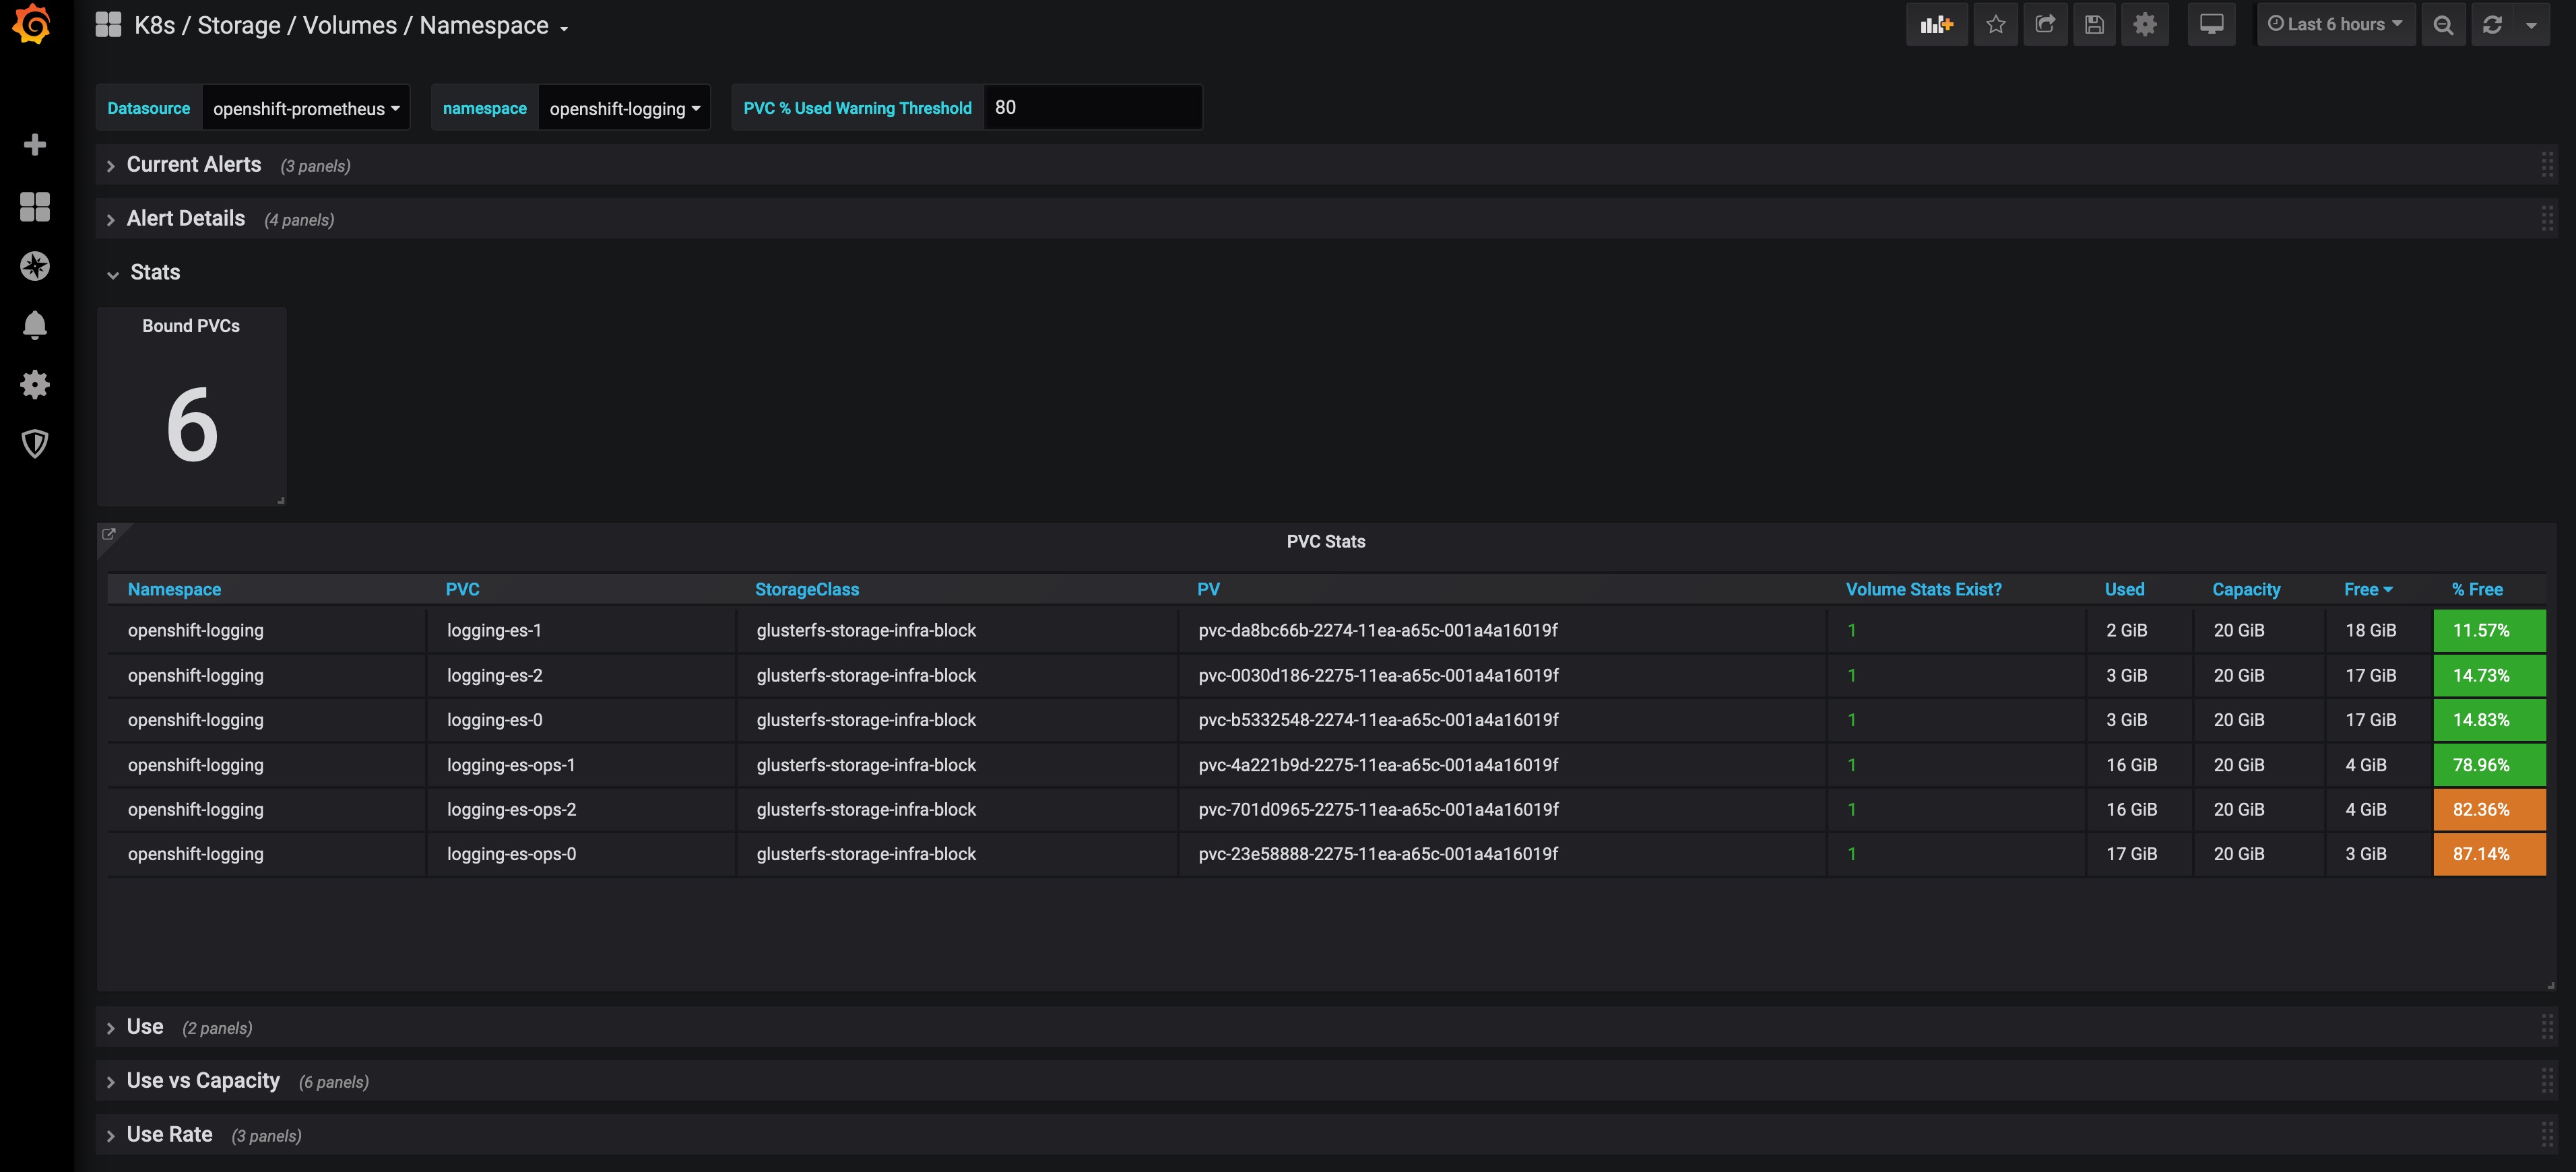
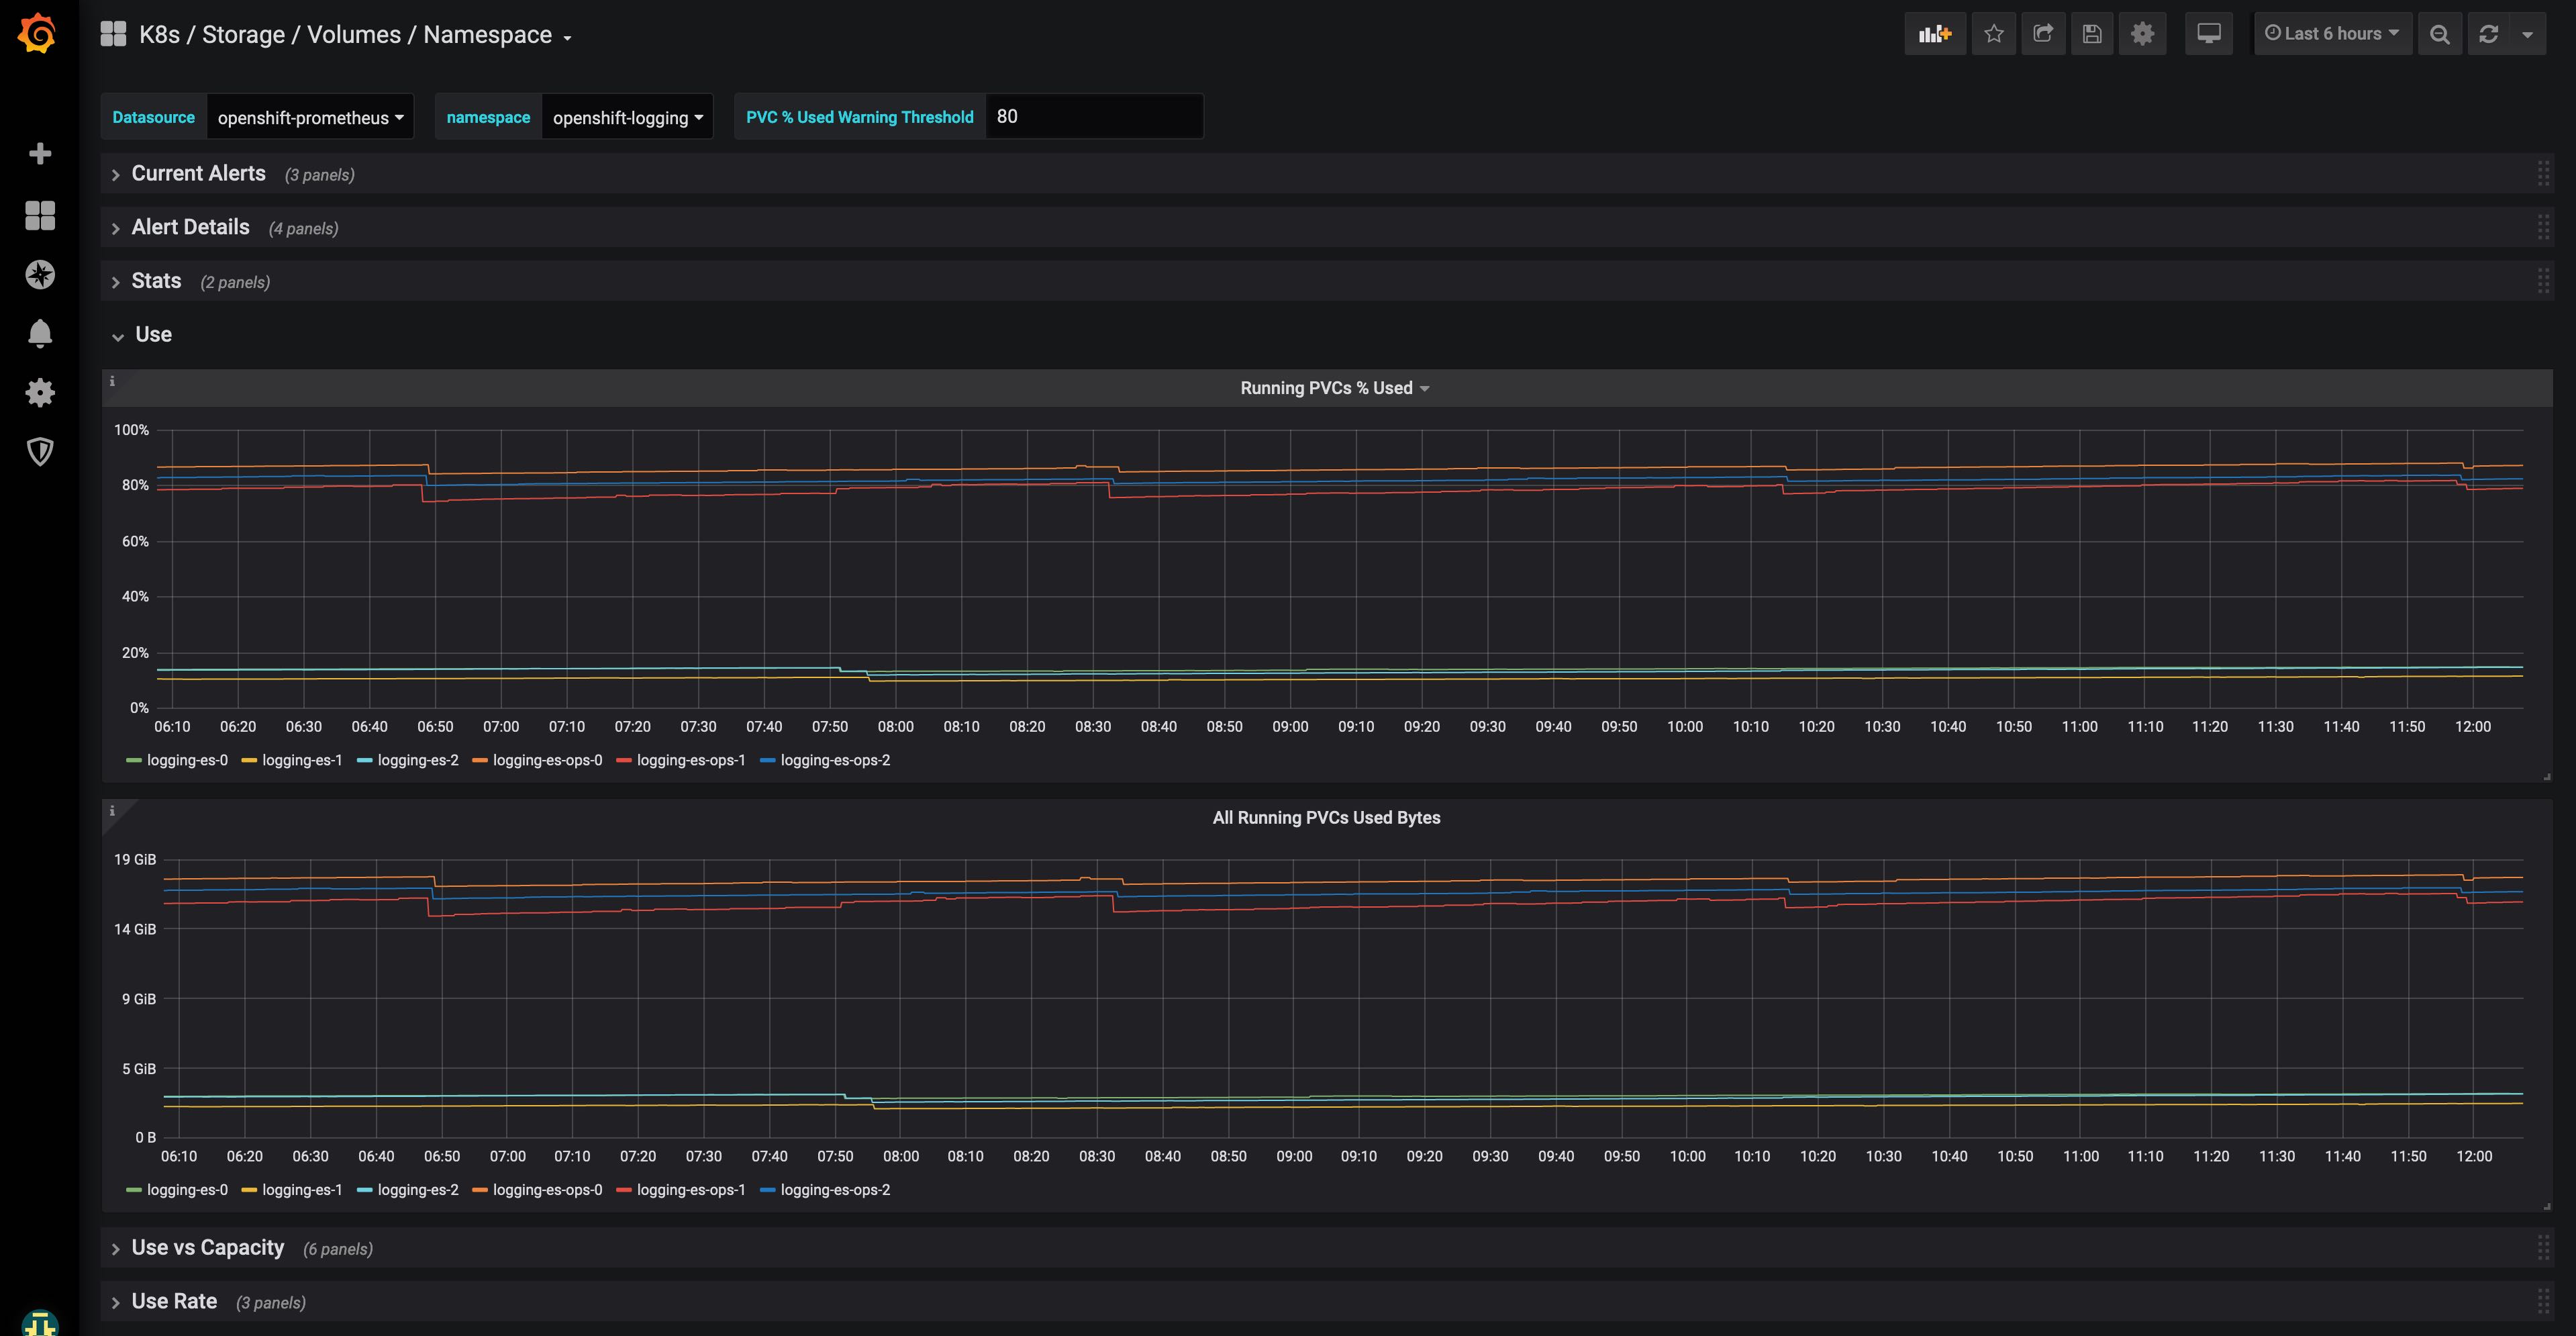
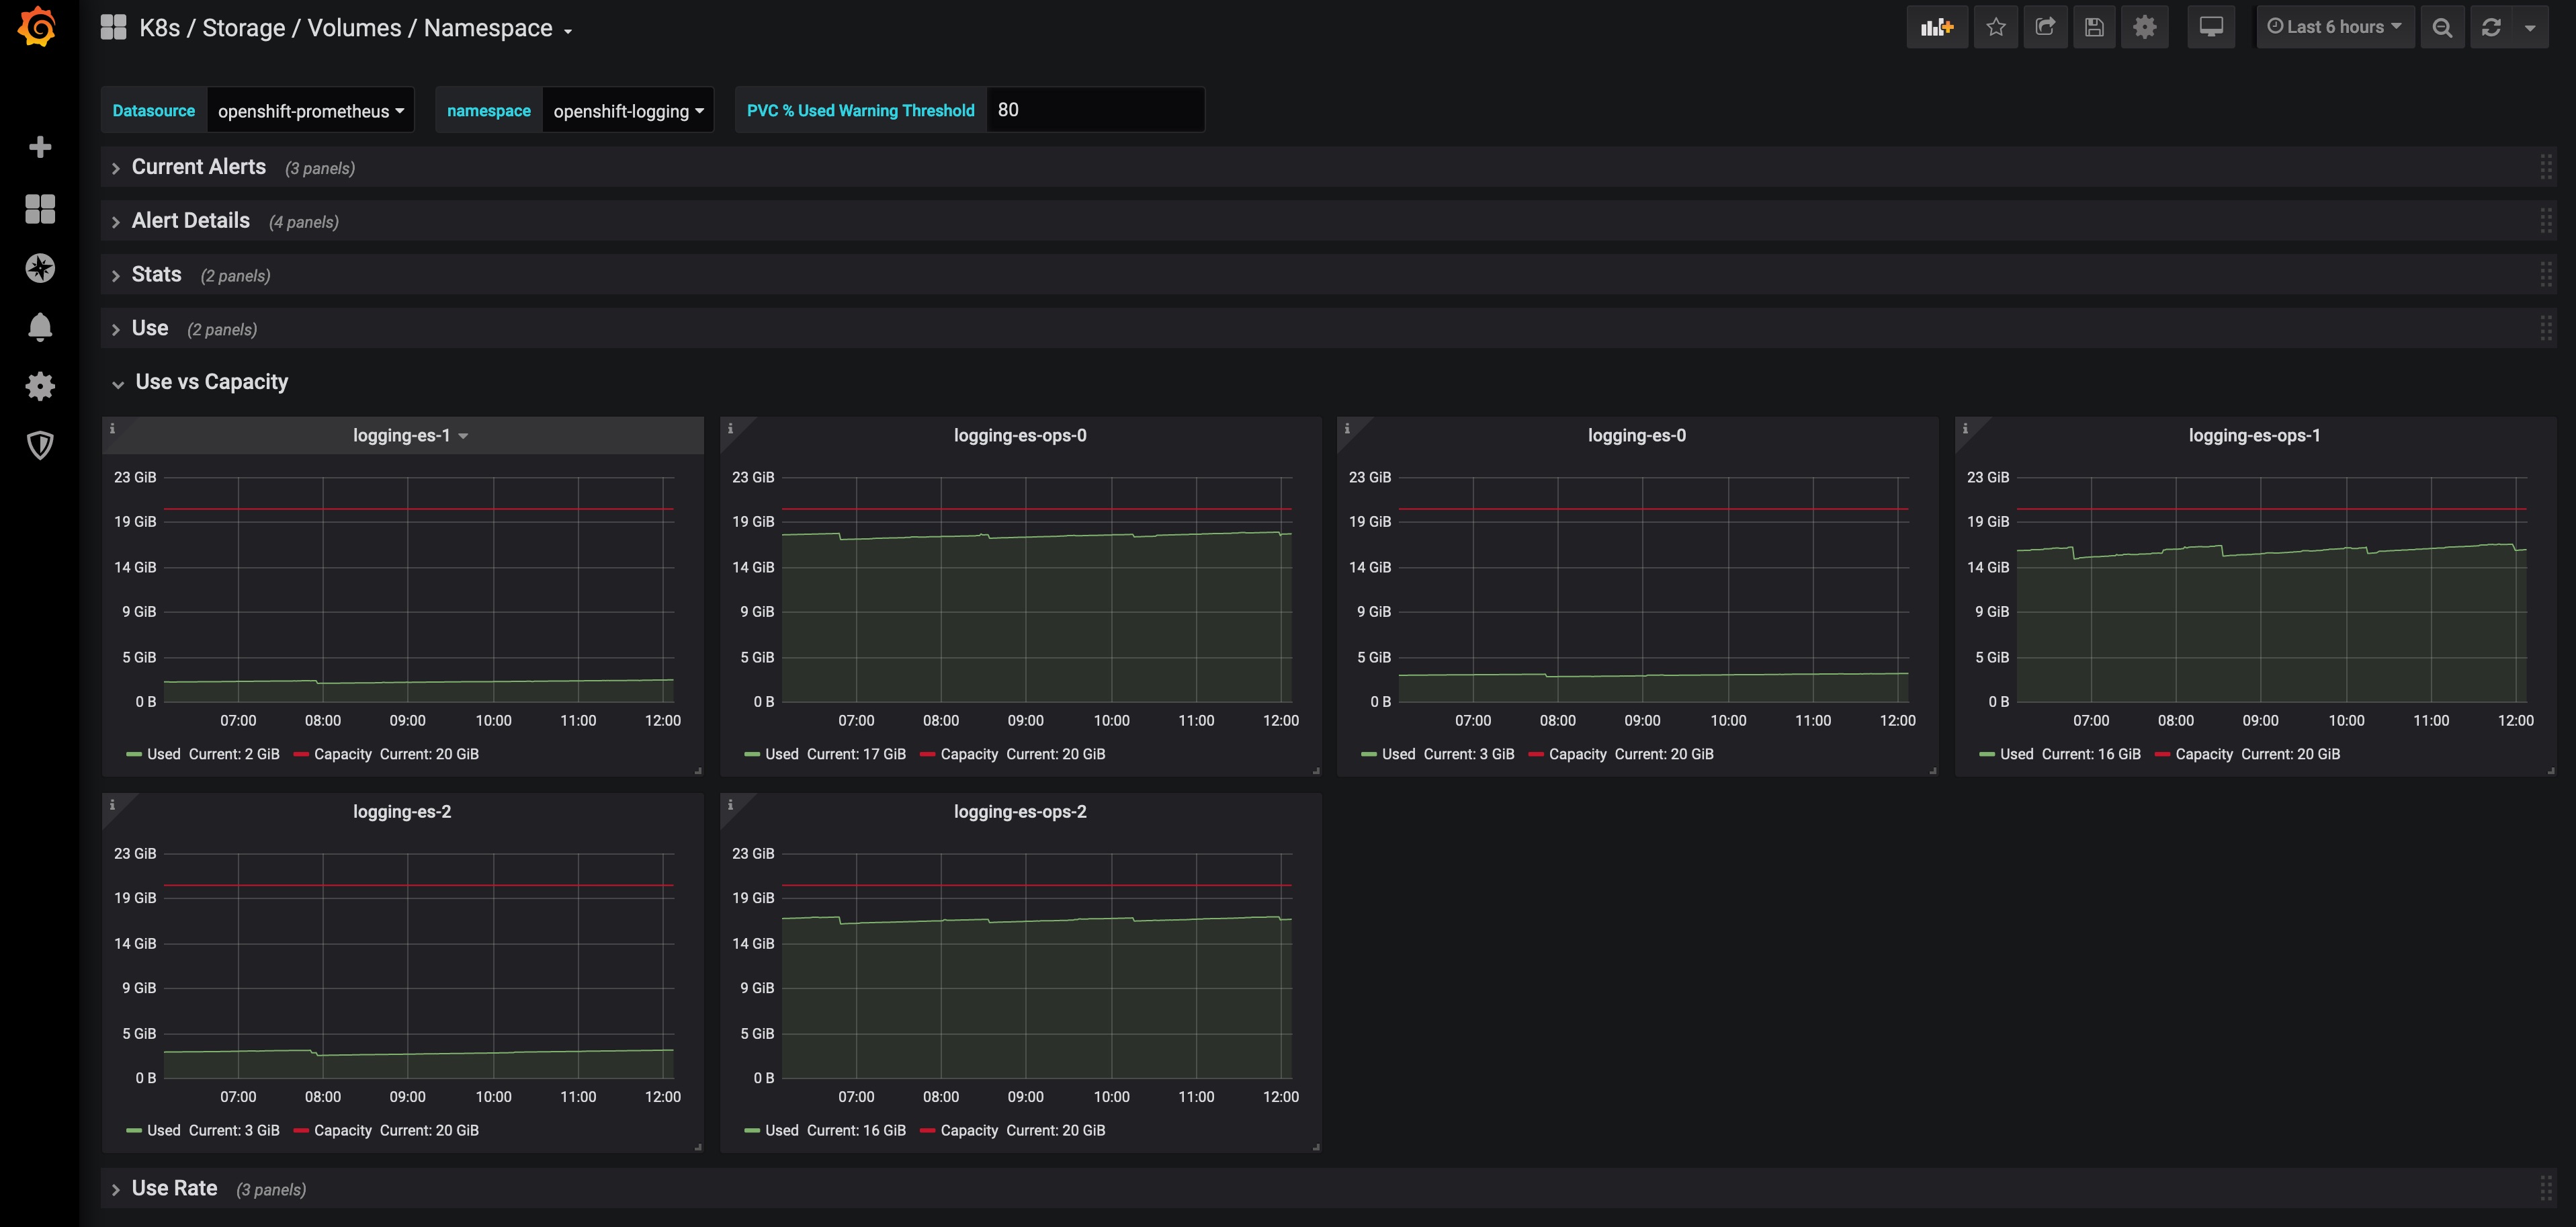
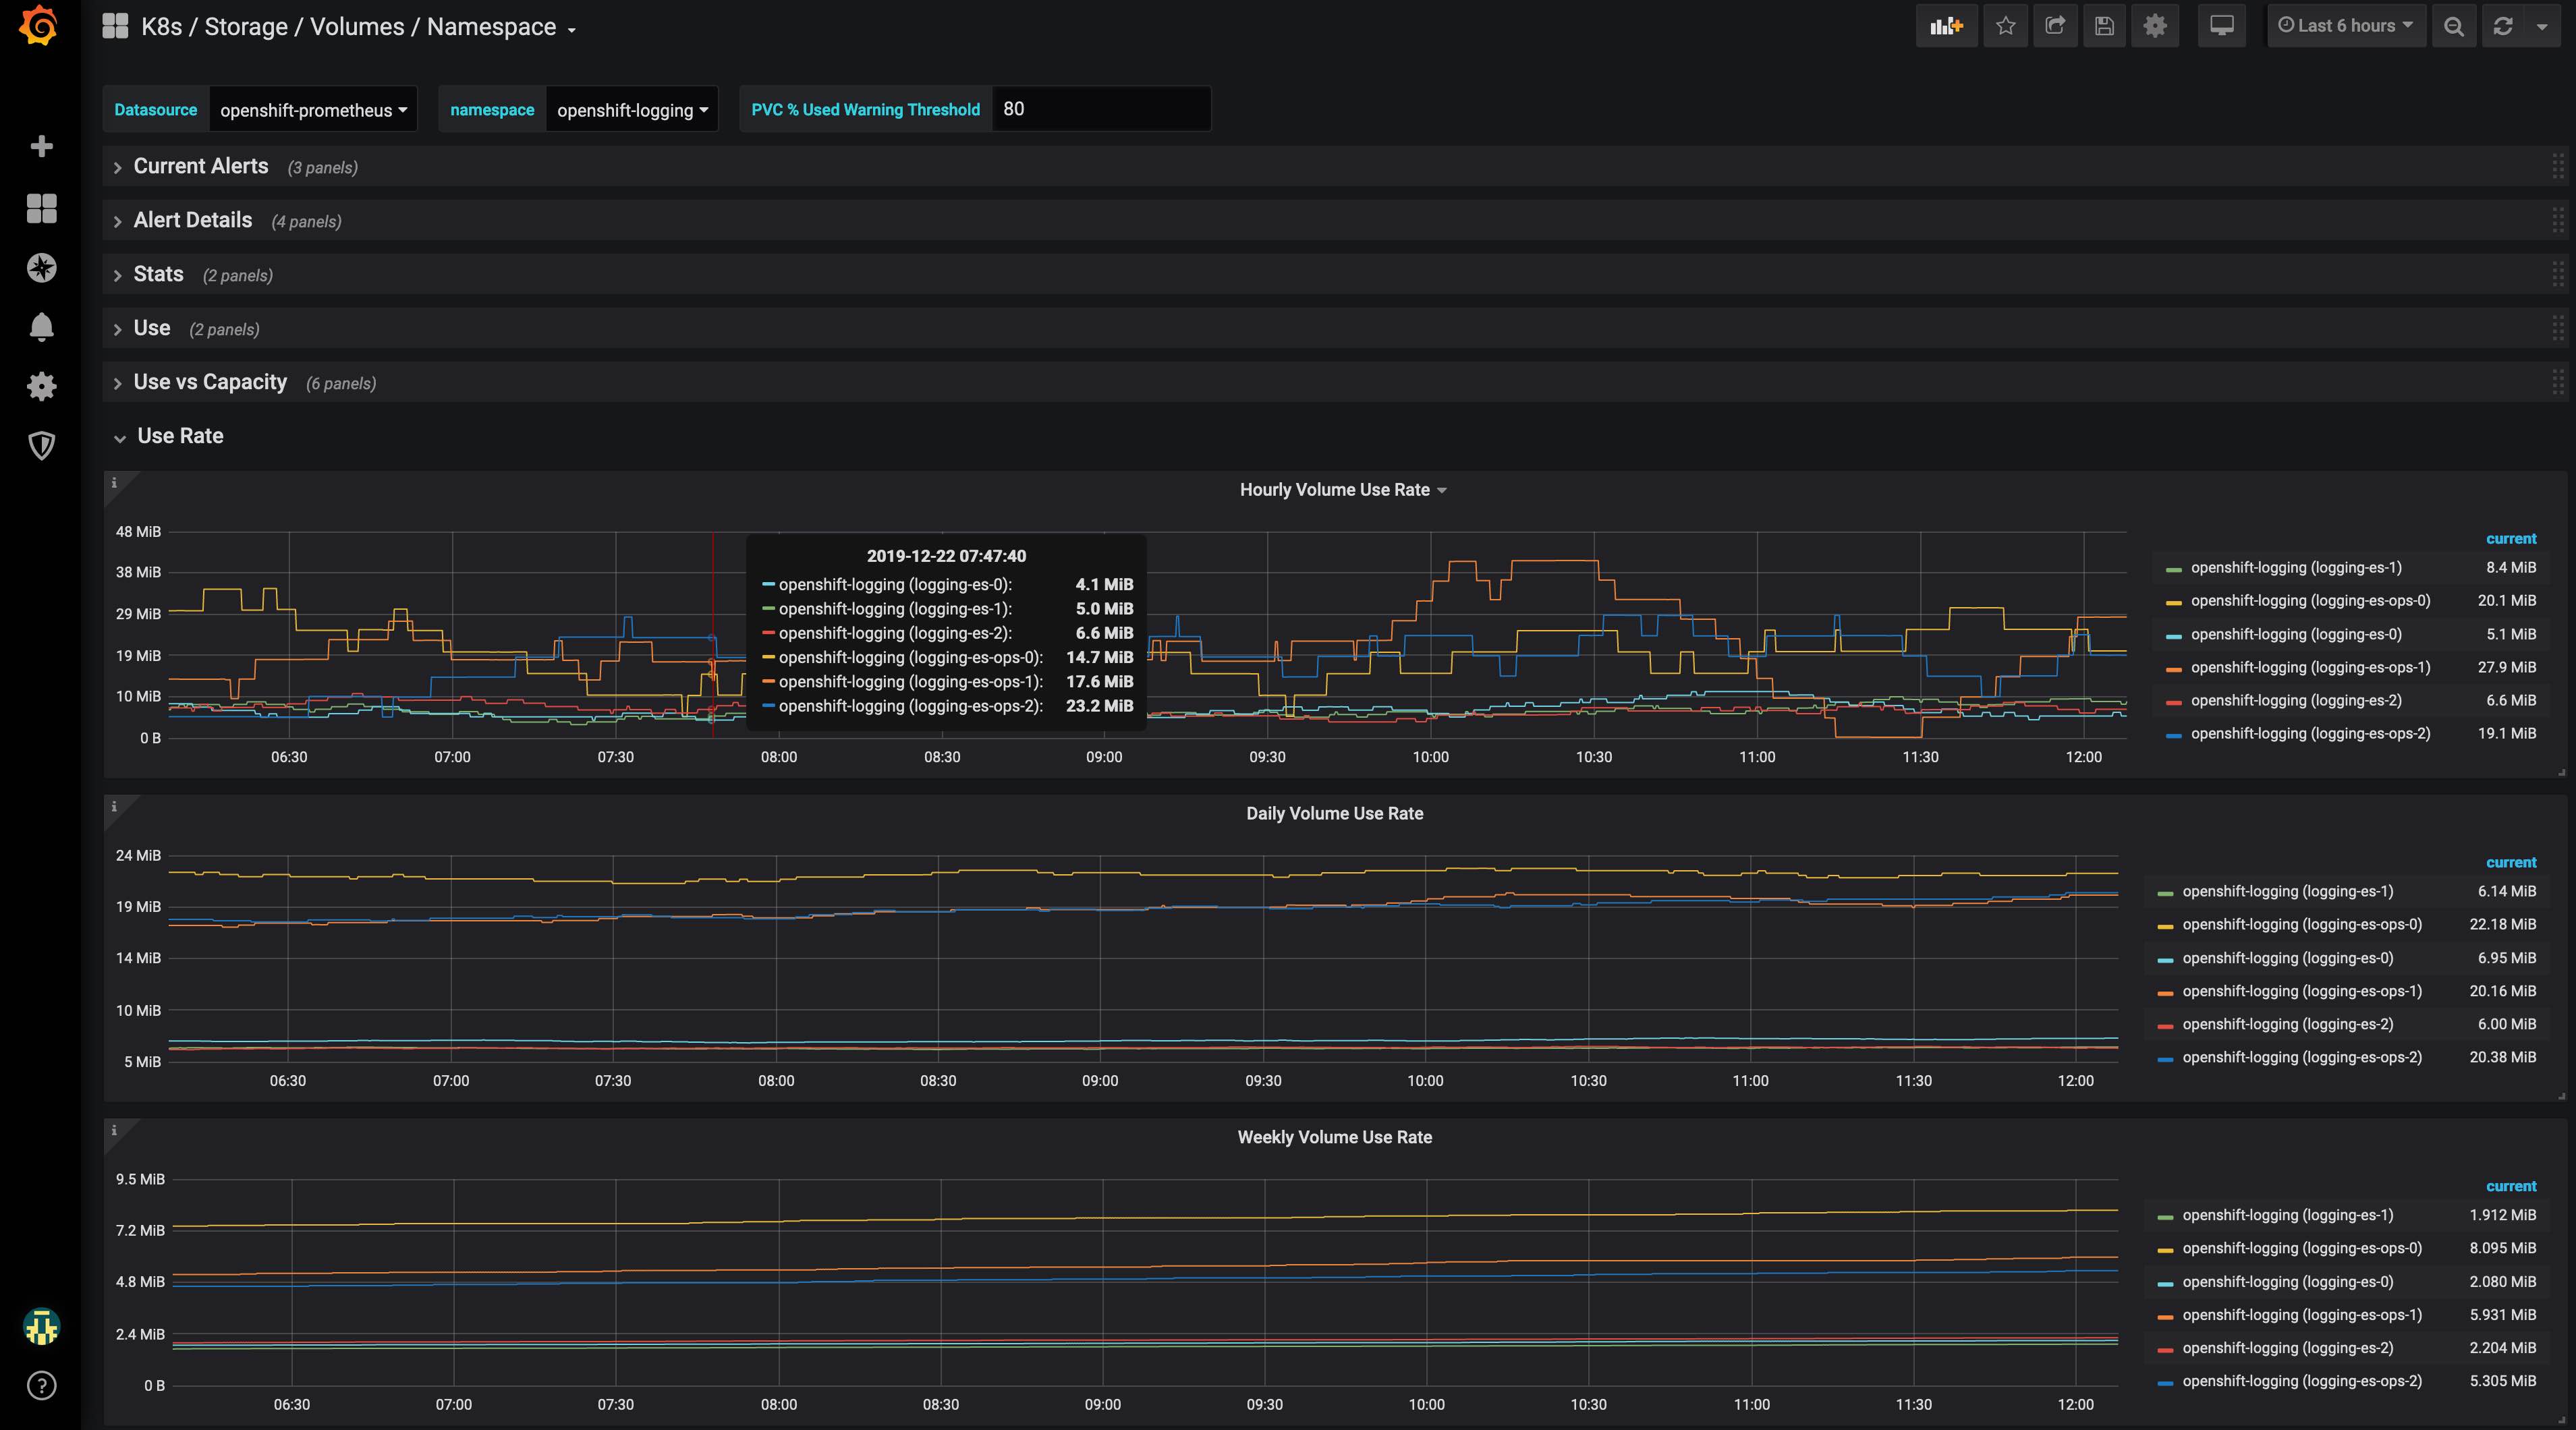
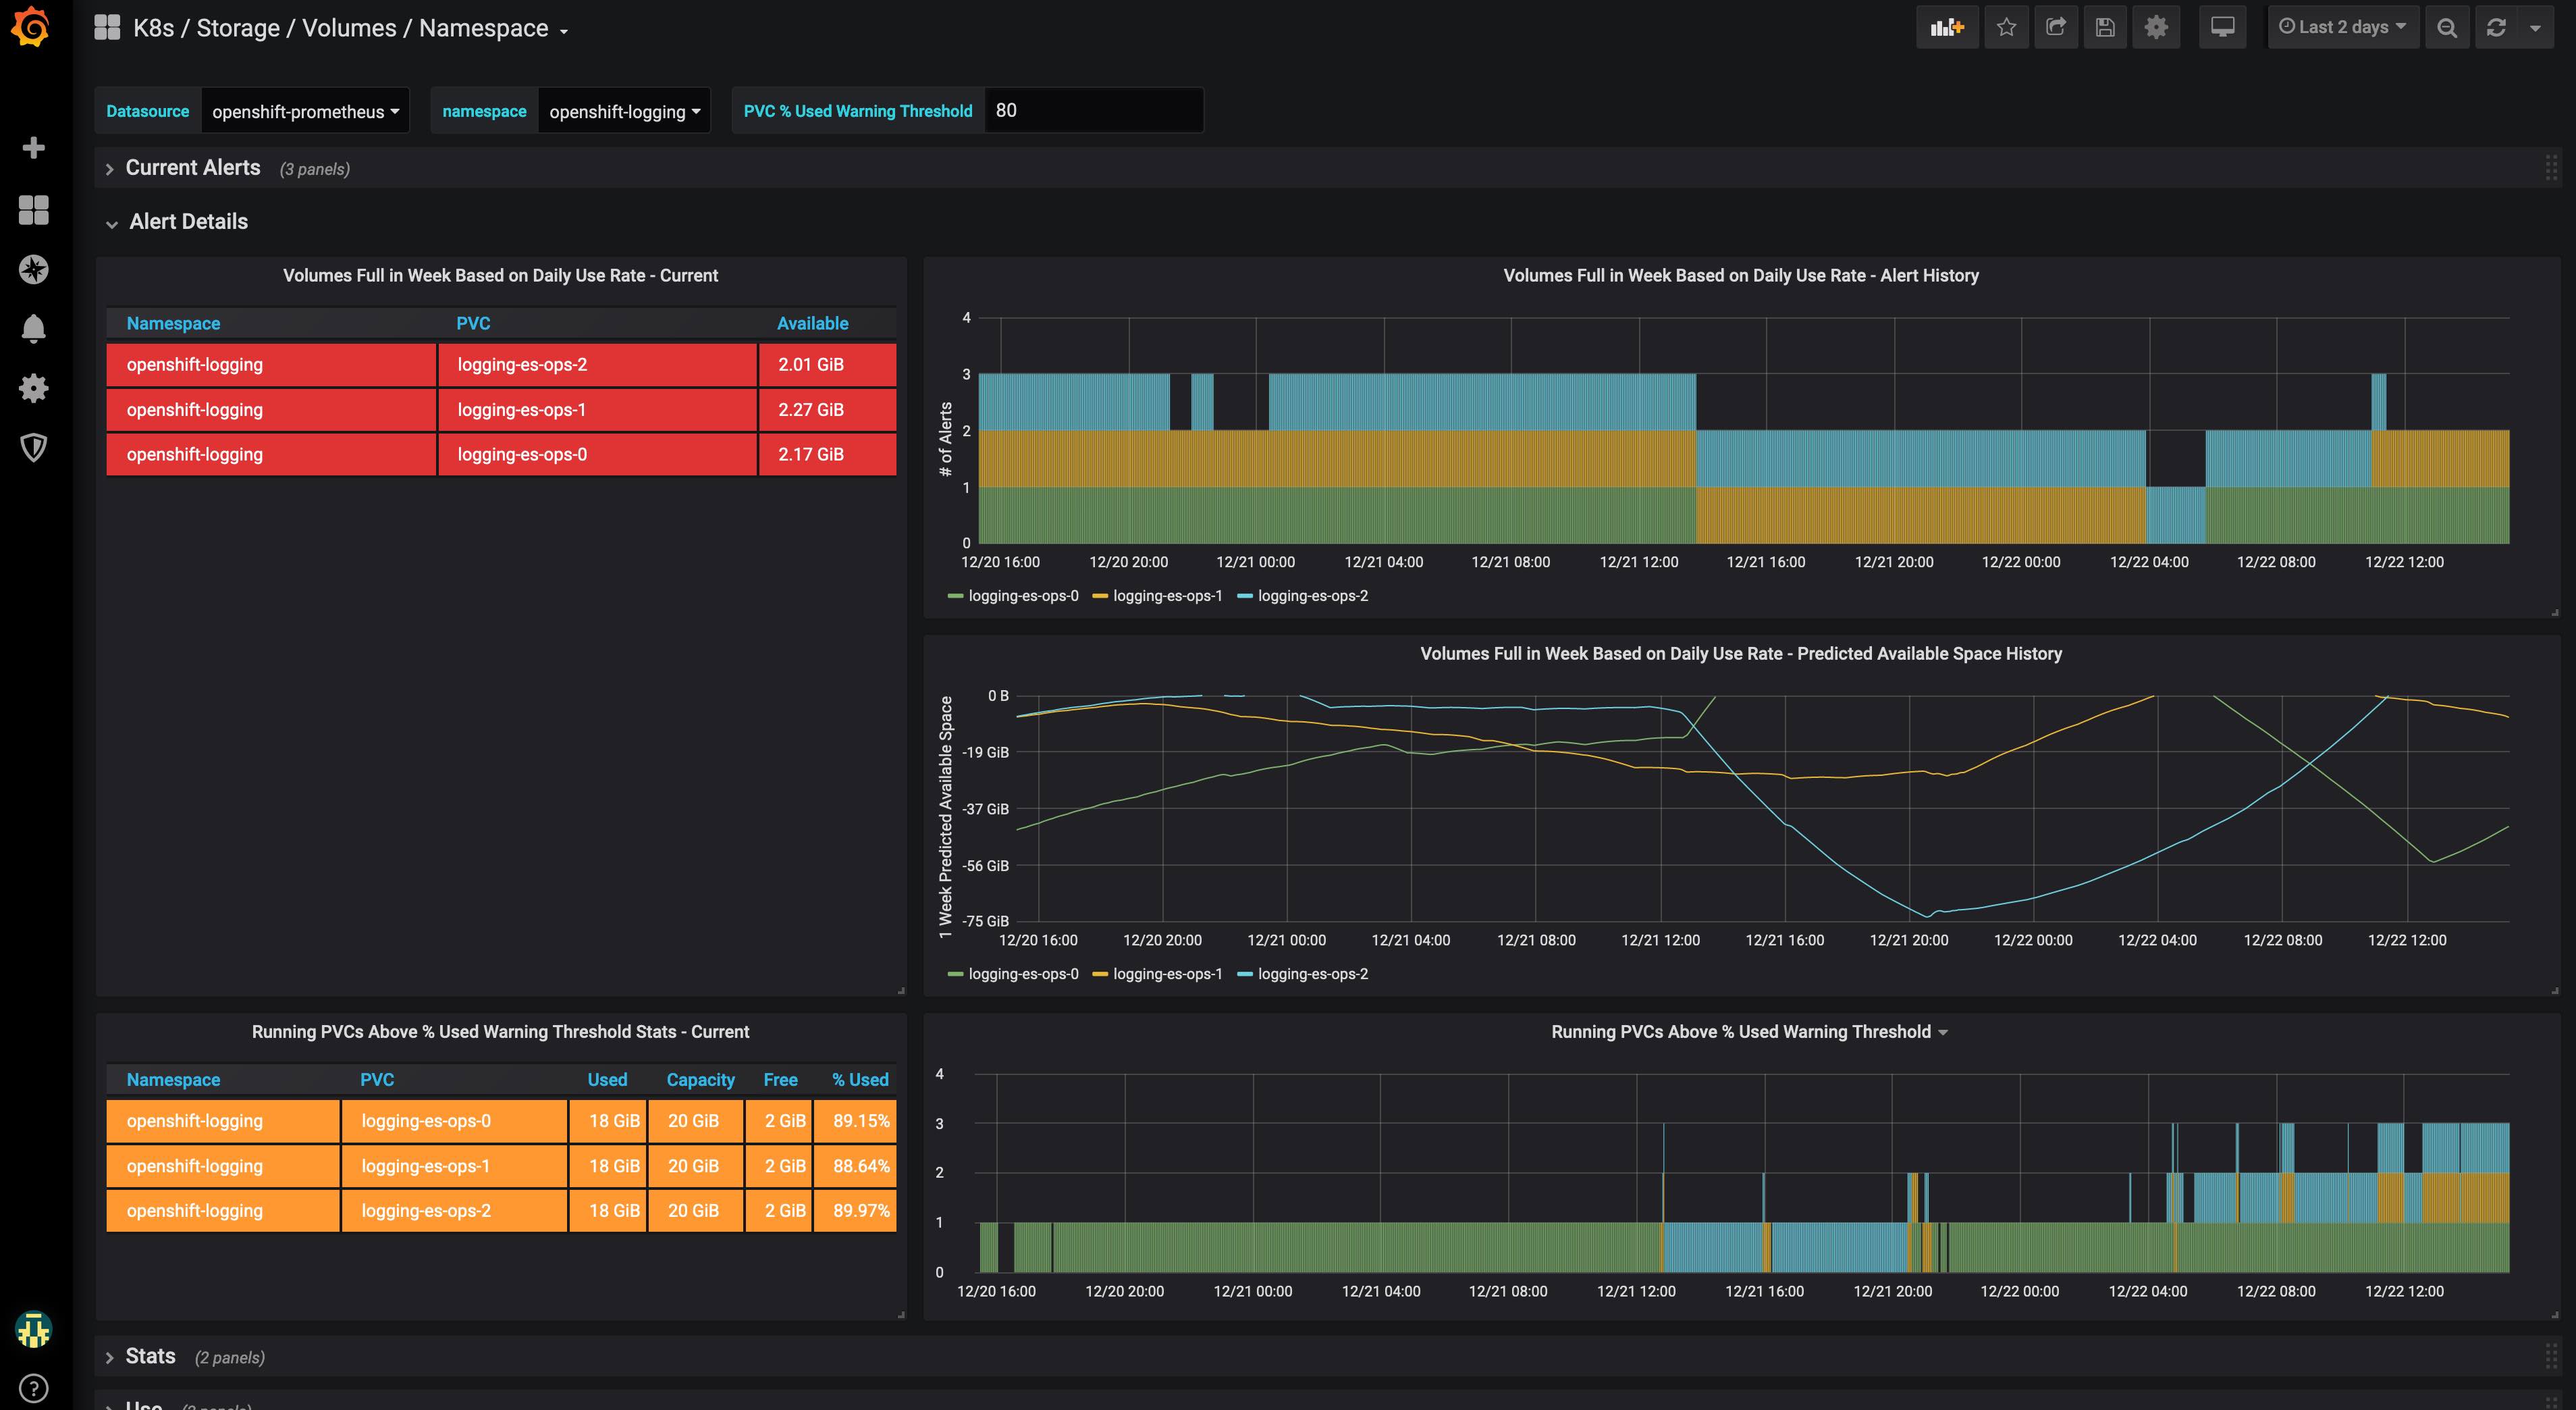
Monitors Kubernetes storage consumption and PVC status across namespaces, focusing on utilization trends, capacity, and unbound volumes. It features time-based usage insight with panels like Volumes Full in Week Based on Daily Use Rate, Running PVCs Above % Used Warning Threshold, and Unbound PVCs, leveraging metrics such as kubelet_volume_stats_capacity_bytes, kubelet_volume_stats_used_bytes, and pvc_percent_used_warning_threshold to track capacity, usage, and alerting thresholds. Additional context comes from pv_collector_unbound_pvc_count to surface lifecycle issues with unbound PVCs."
Screenshots
Used Metrics 55
kubelet_volume_stats_available_bytes
kubelet_volume_stats_capacity_bytes
kubelet_volume_stats_used_bytes
pv_collector_unbound_pvc_count
pvc_percent_used_warning_threshold