K8s / Storage / Heketi 2,069,4652,069,465
12/21/2019
12/26/2019
8
>=6.5.2
Prometheus
Description
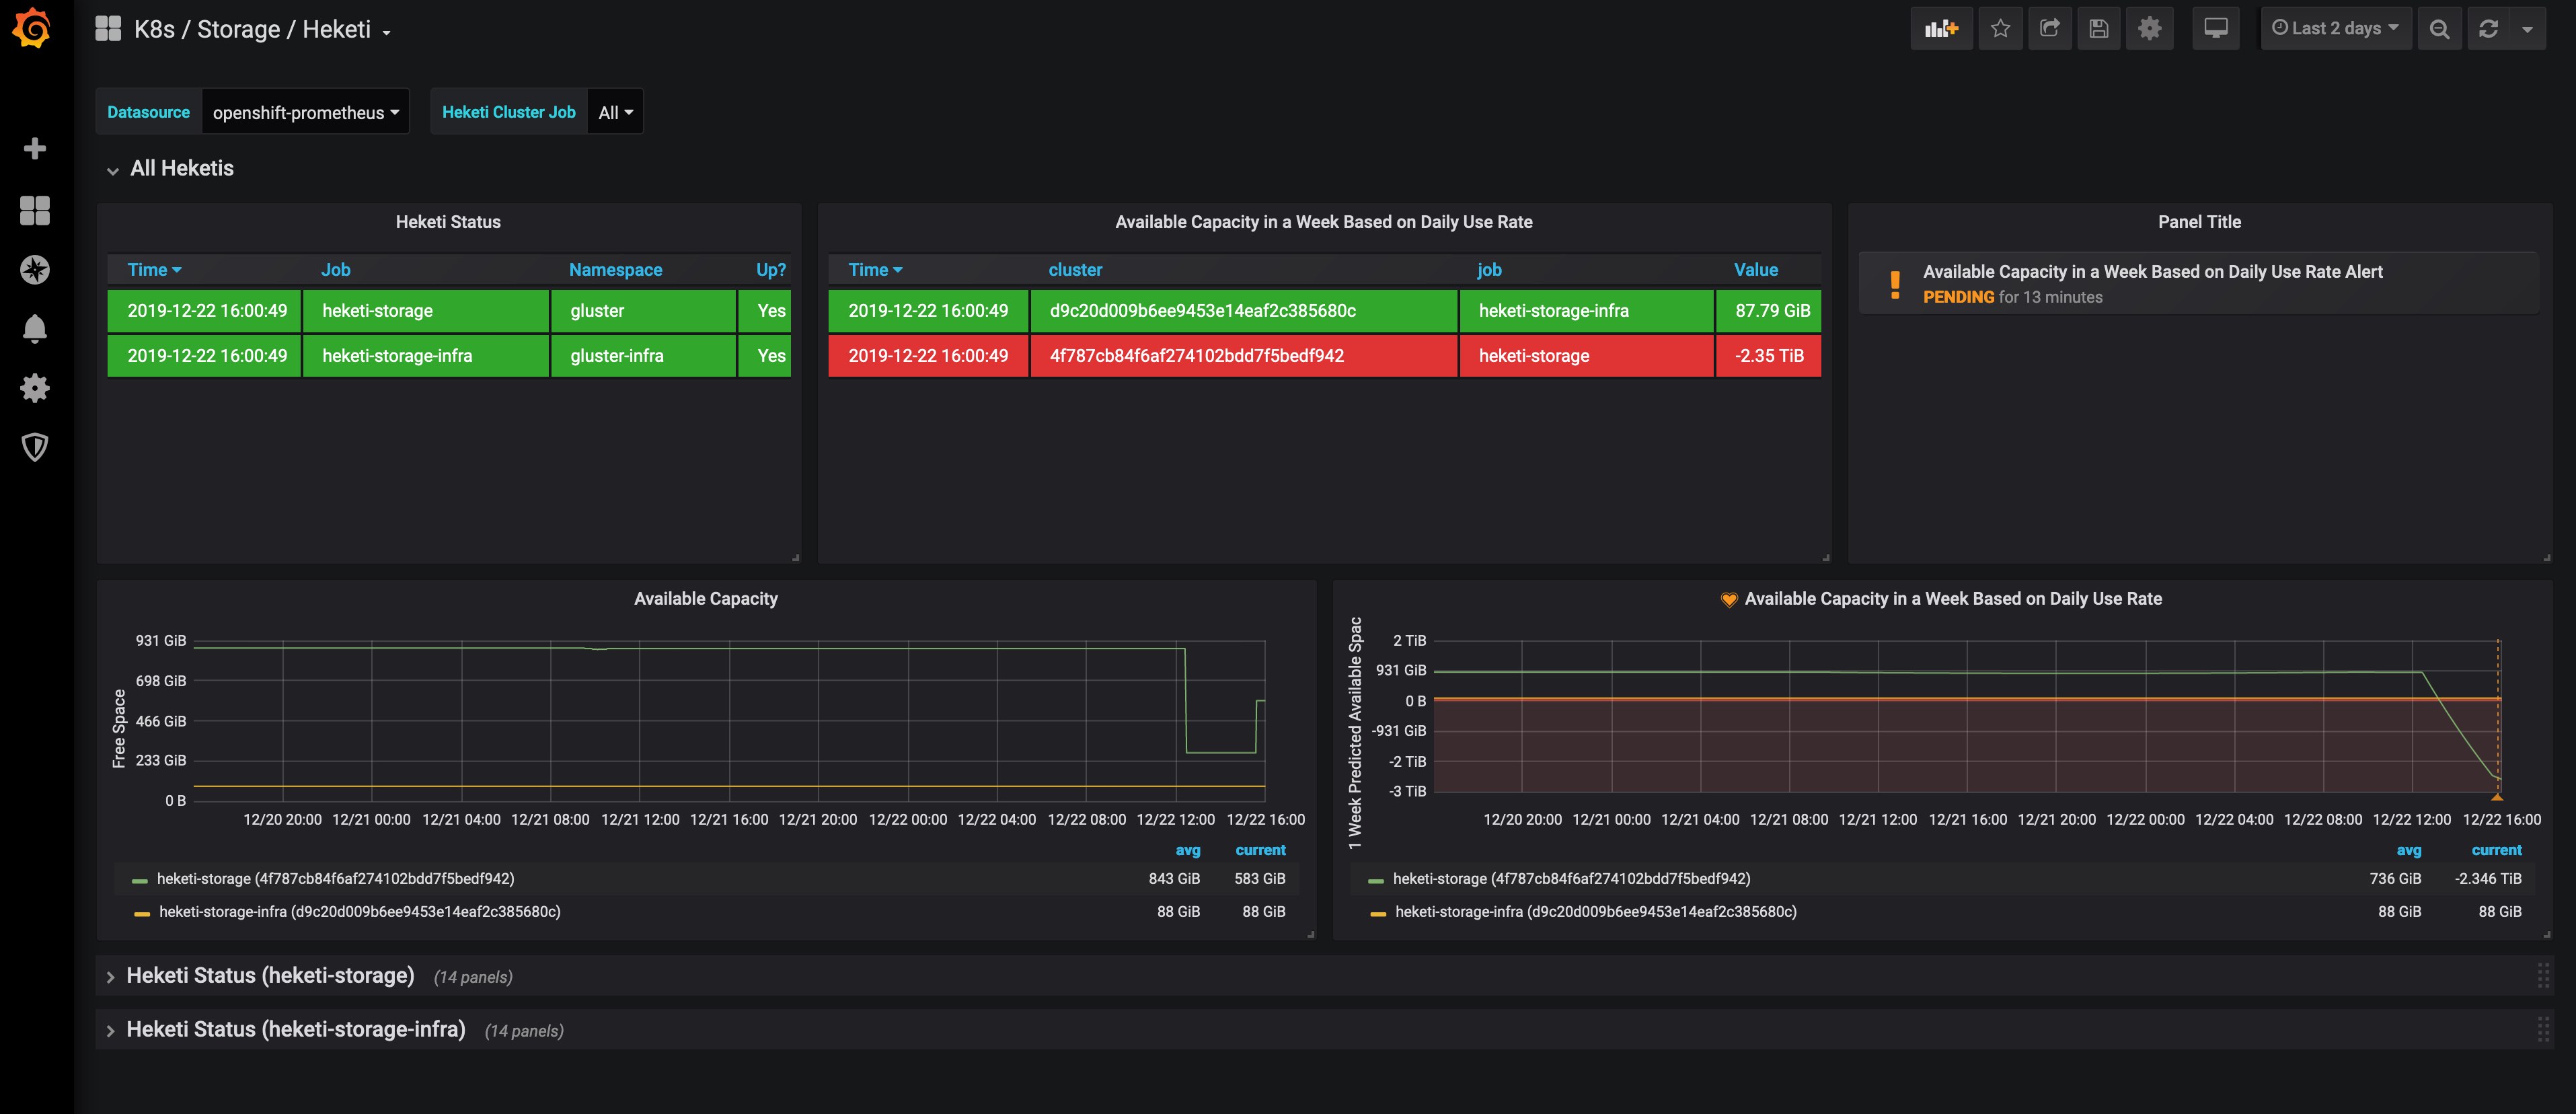
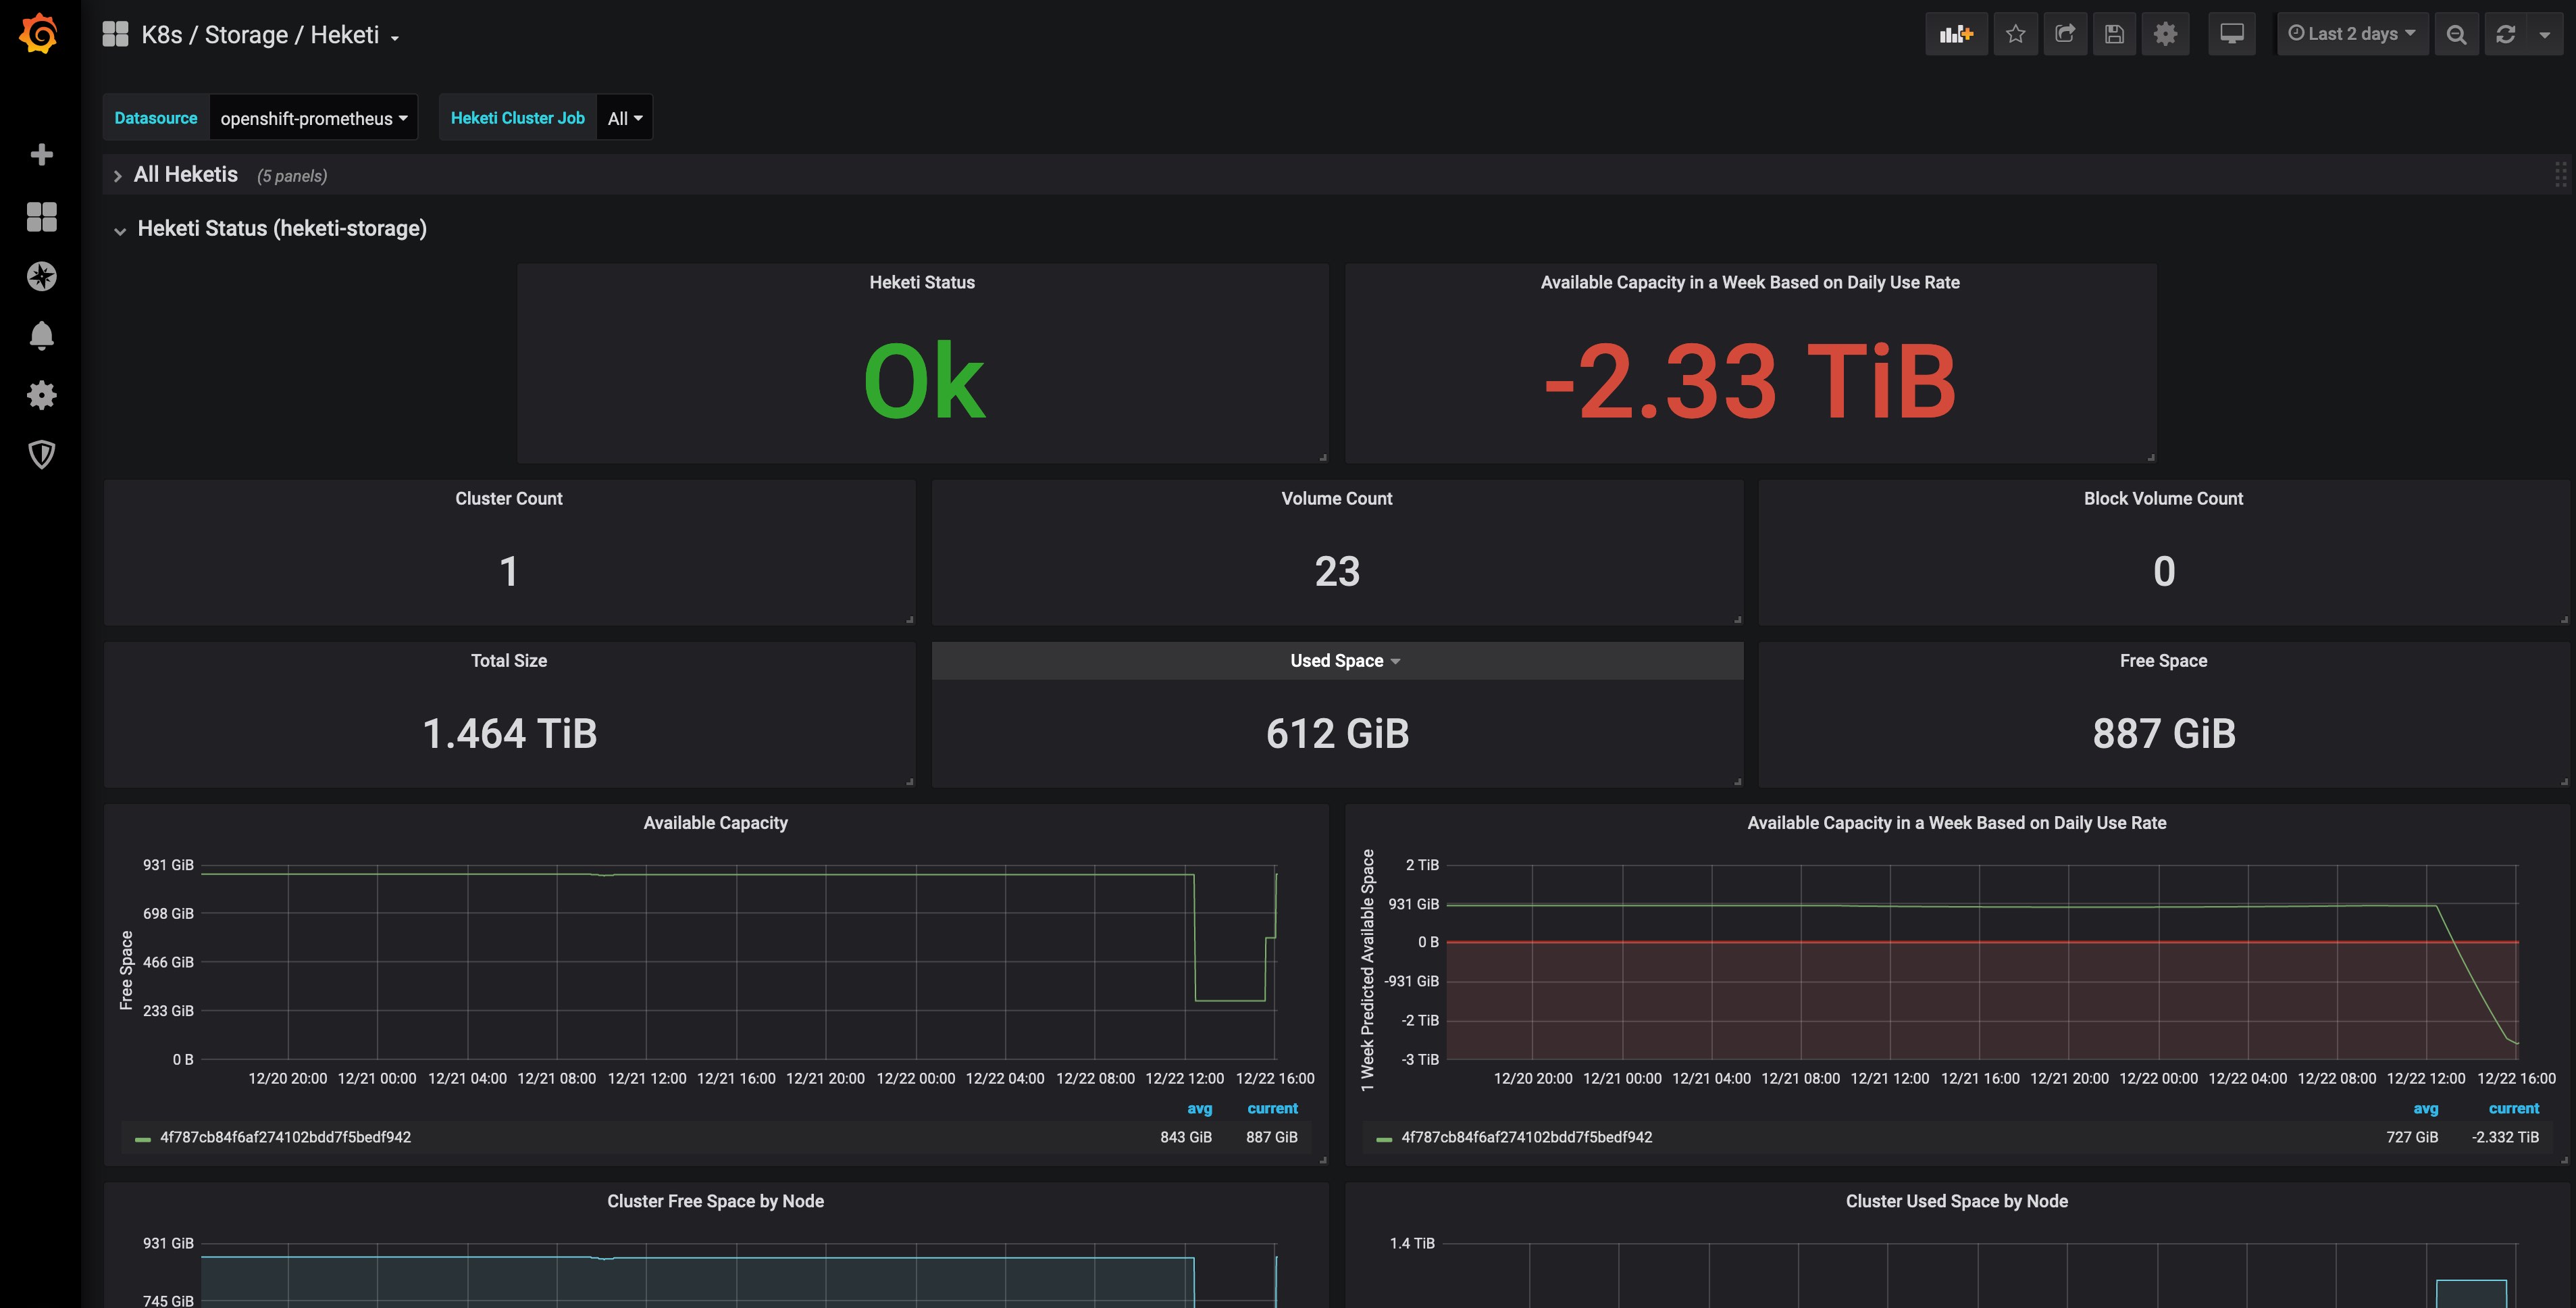
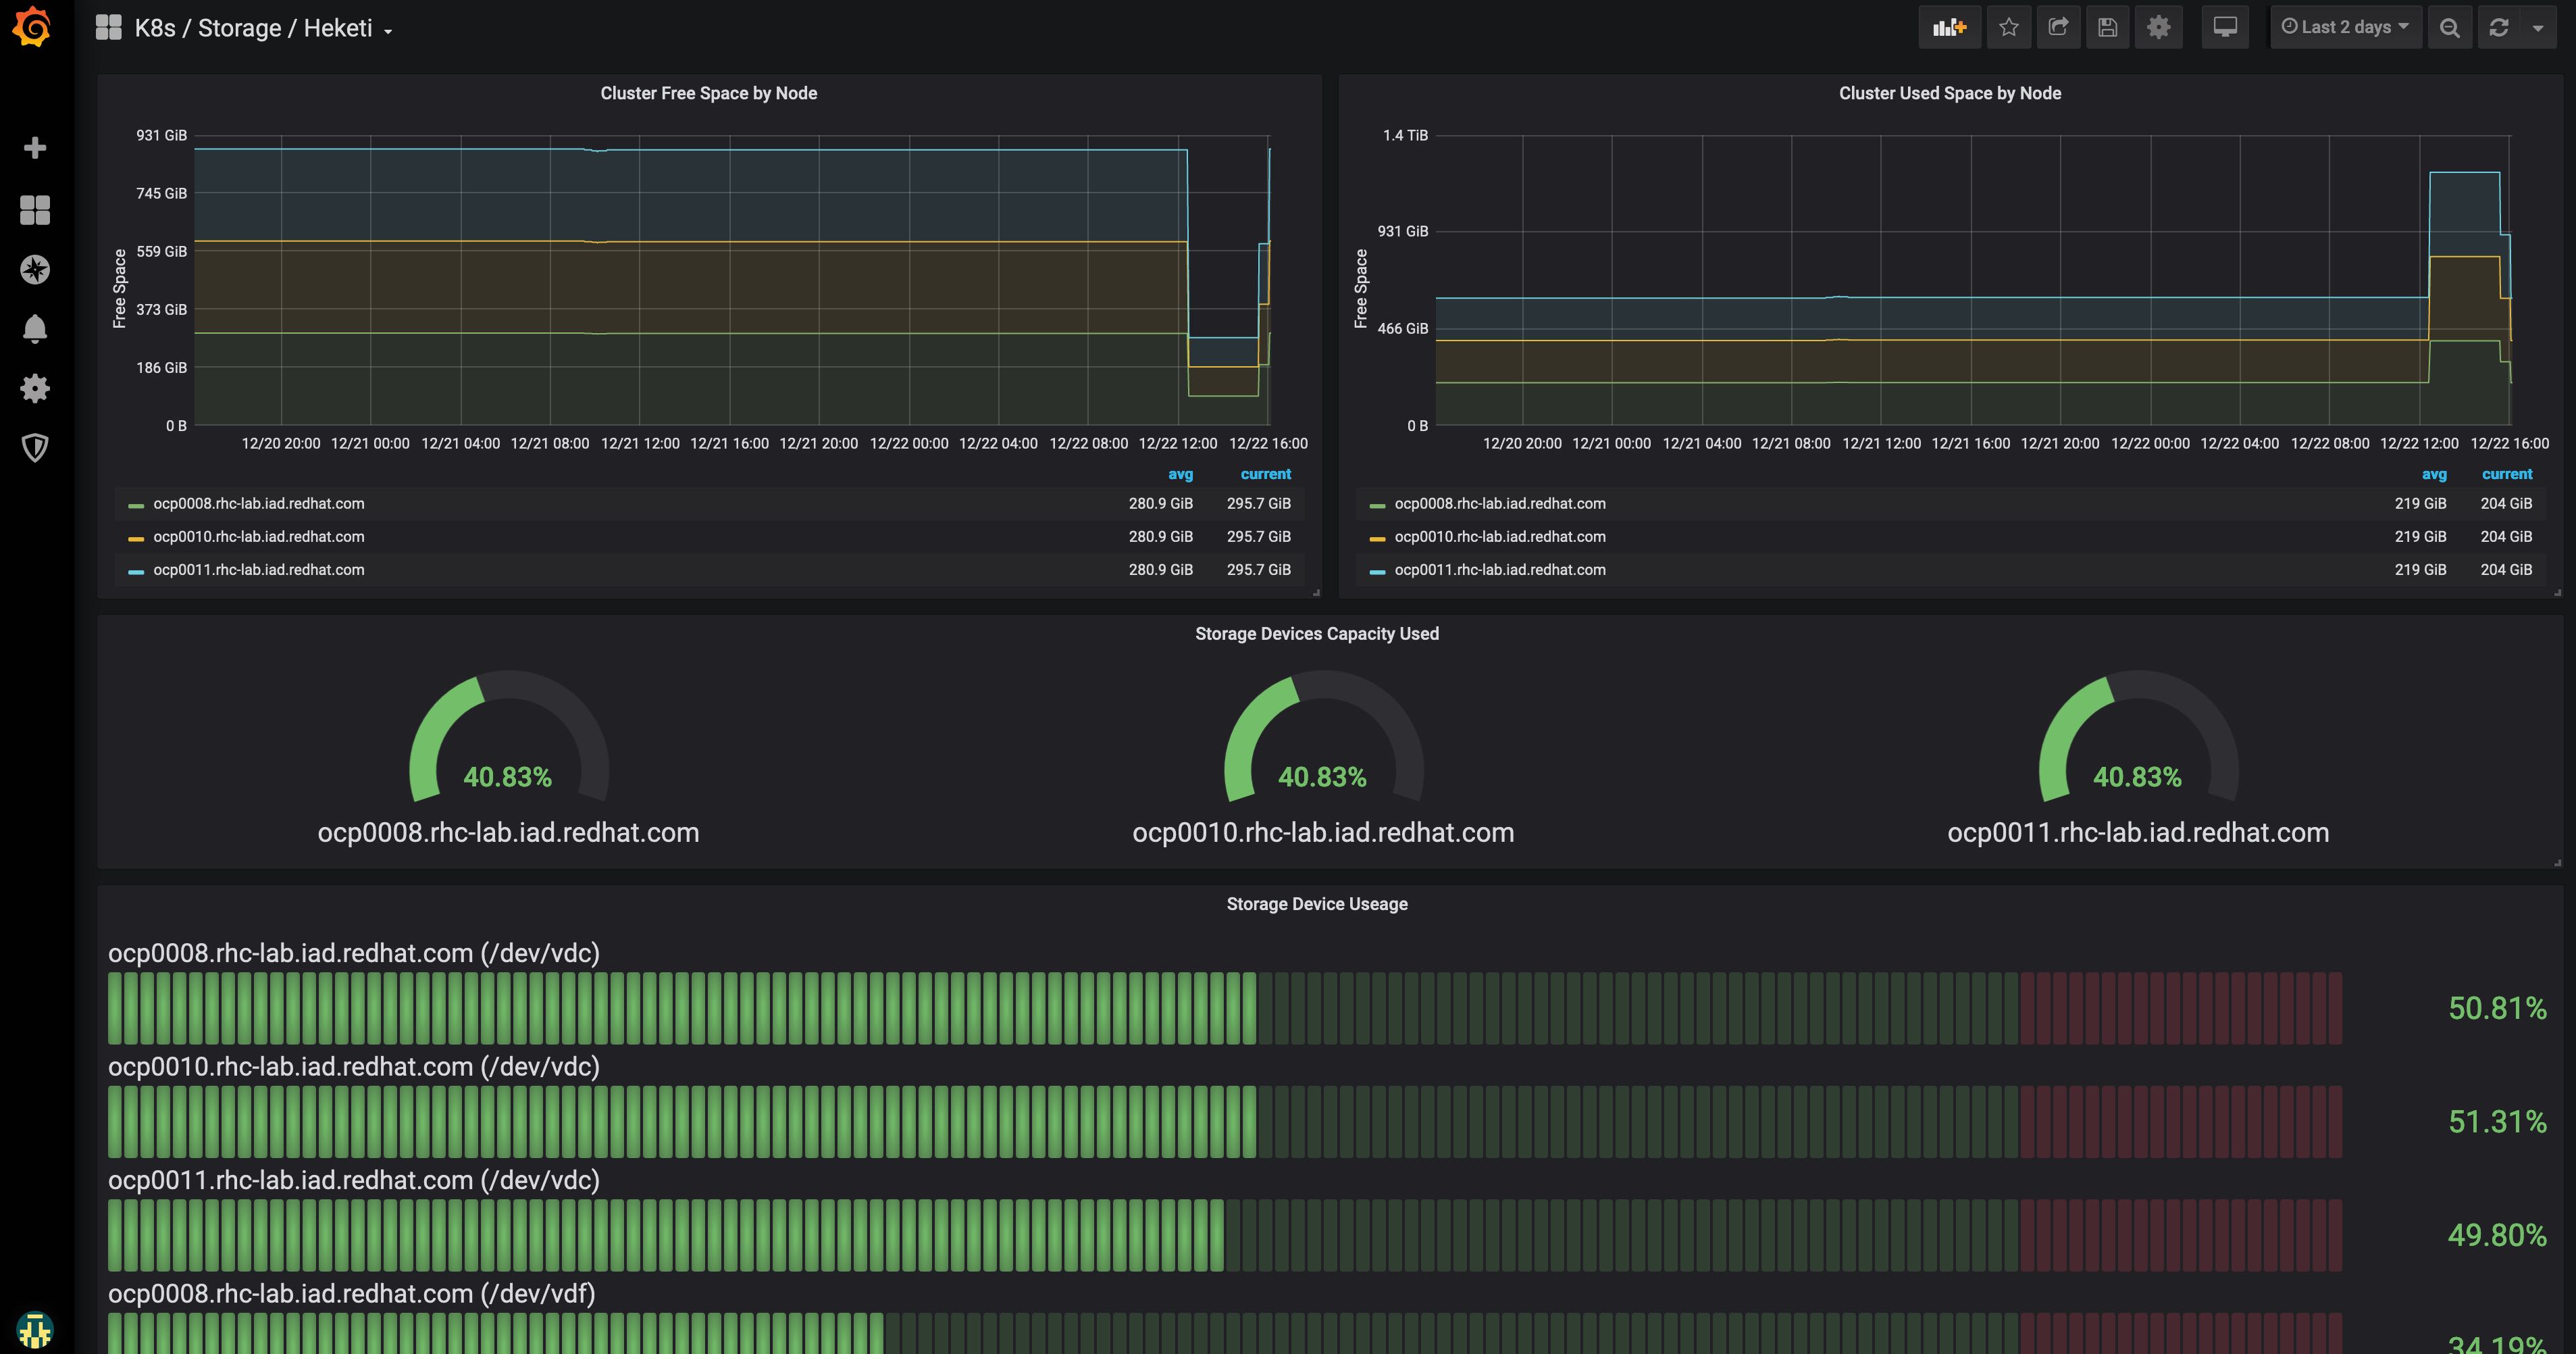
This dashboard monitors Kubernetes storage health and capacity using metrics such as heketi_up to indicate service availability and heketi_device_free_bytes to track free storage on devices. It includes a trend view like Available Capacity in a Week Based on Daily Use Rate to project future space and alerting on storage status via Heketi Status, providing a concise view of current capacity, utilization trends, and health checks for Heketi-managed storage.
Screenshots
Used Metrics 22
heketi_device_free_bytes
heketi_up
Get Dashboard✕
Download
Copy to Clipboard