K8s RKE General chart 46,95446,954
Description
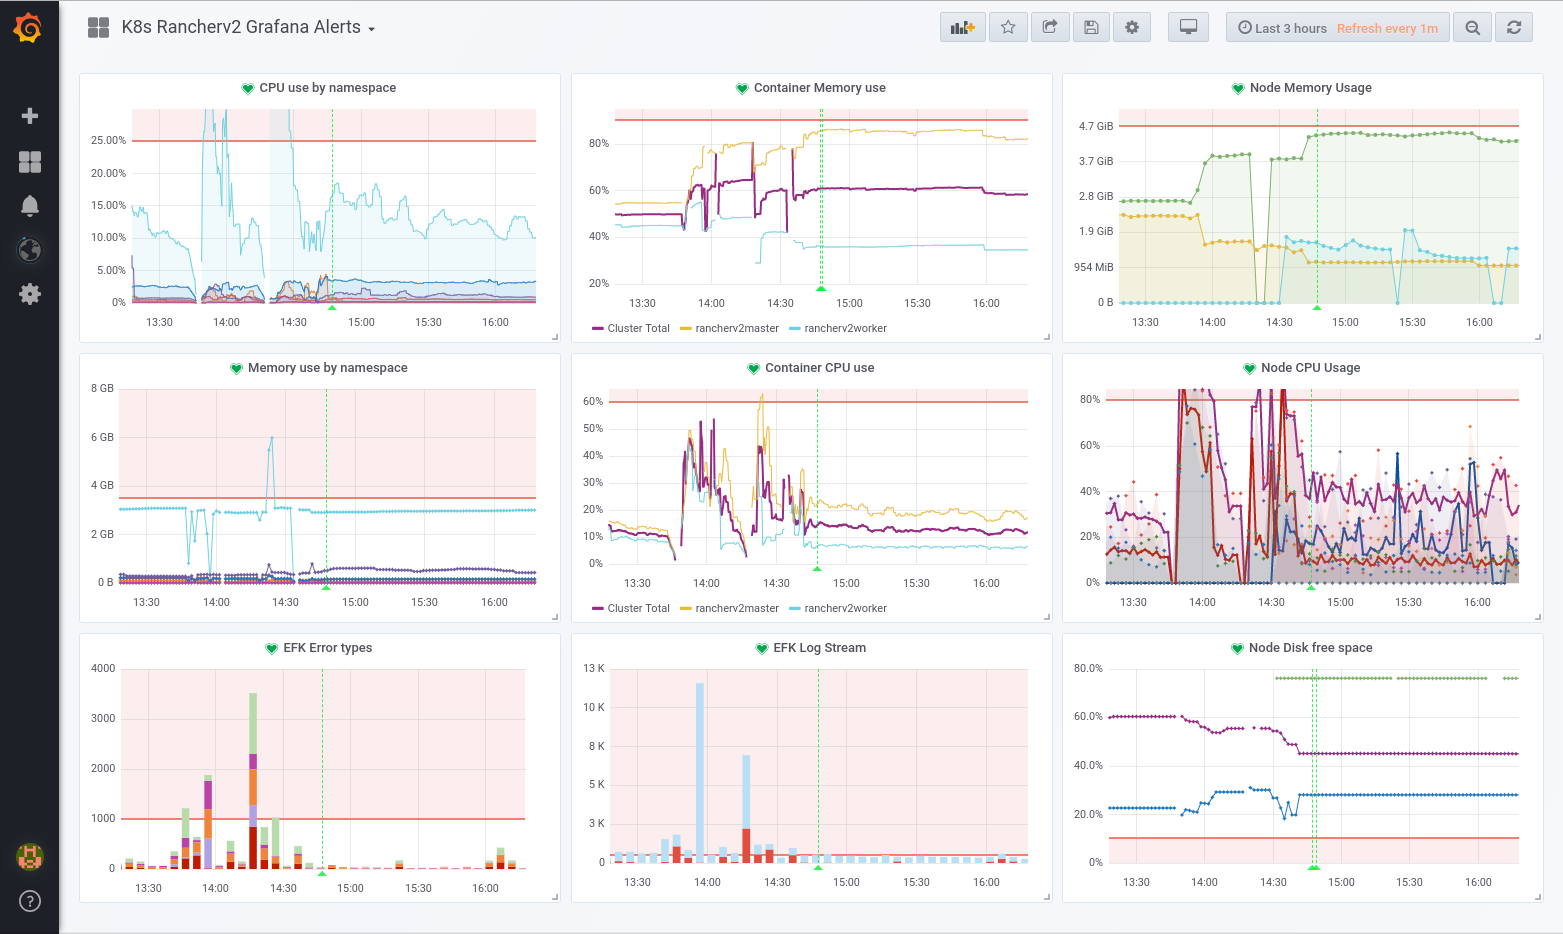
This dashboard provides an end-to-end view of a Kubernetes cluster on RKE, focusing on resource utilization across namespaces, nodes, and containers. It highlights CPU and memory consumption with panels like container_cpu_usage_seconds_total, kube_node_status_capacity_cpu_cores, and node_memory_MemTotal_bytes, along with disk and Loki/log streaming metrics to surface storage and logging health; panels such as Node Disk free space and Loki Messages by namespace help correlate workload activity with node capacity and log throughput.
Screenshots
Used Metrics 1111
-
container_cpu_usage_seconds_total
-
container_memory_working_set_bytes
kube_node_status_capacity_cpu_cores
-
node_cpu_seconds_total
-
node_filesystem_free_bytes
-
node_filesystem_size_bytes
-
node_memory_Buffers_bytes
-
node_memory_Cached_bytes
-
node_memory_MemFree_bytes
-
node_memory_MemTotal_bytes
-
node_memory_Slab_bytes