K8S Control Plane 67,19567,195
Description
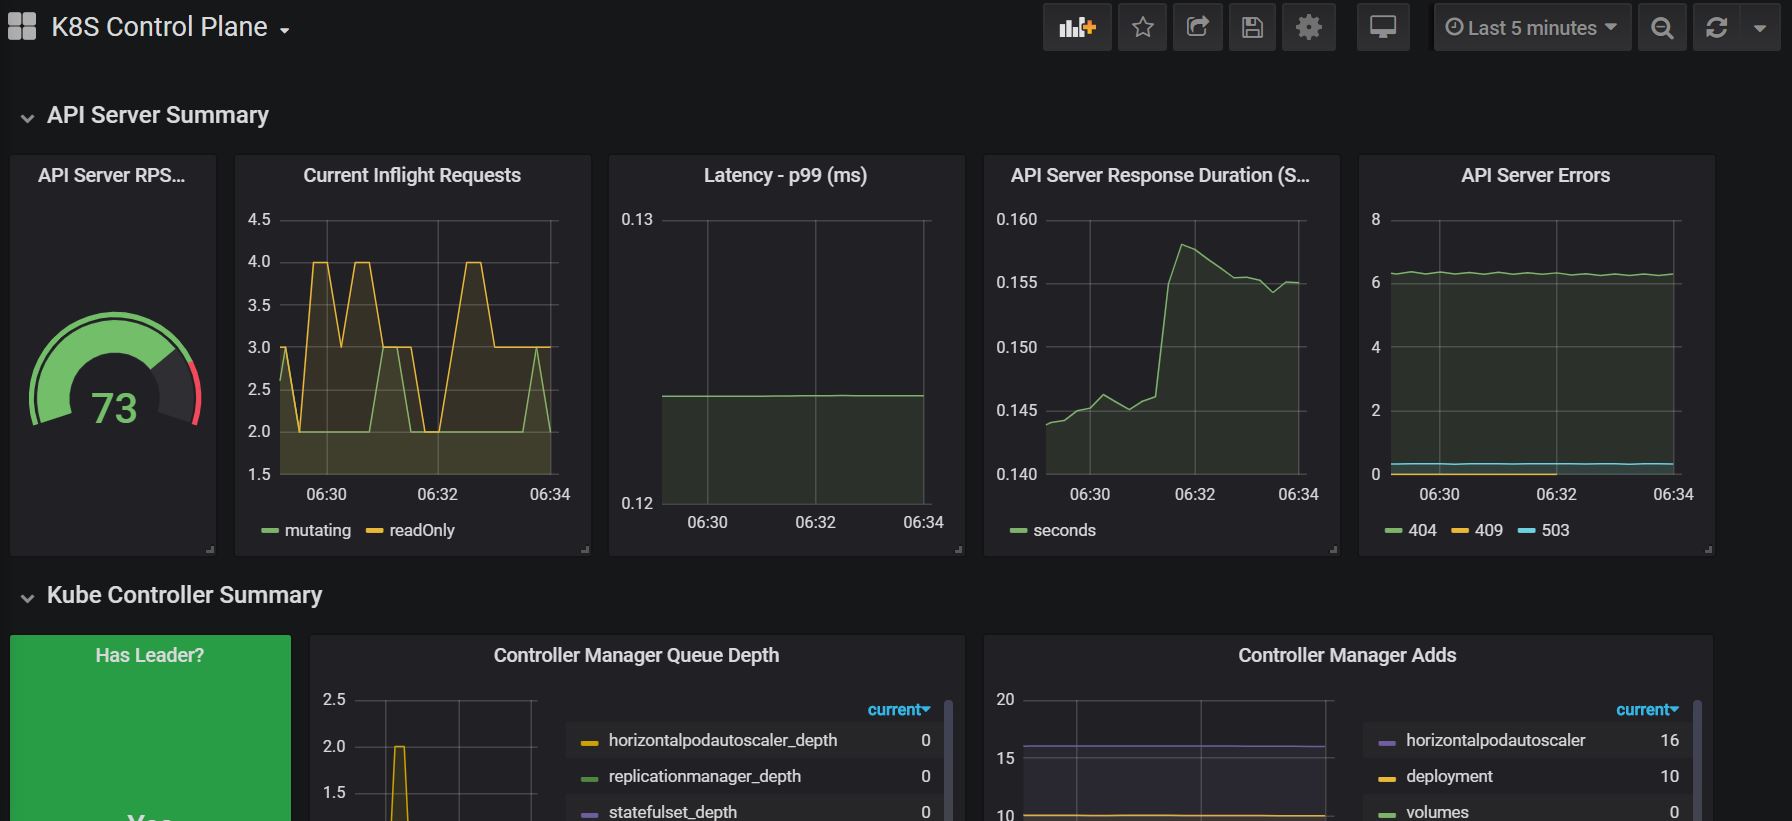
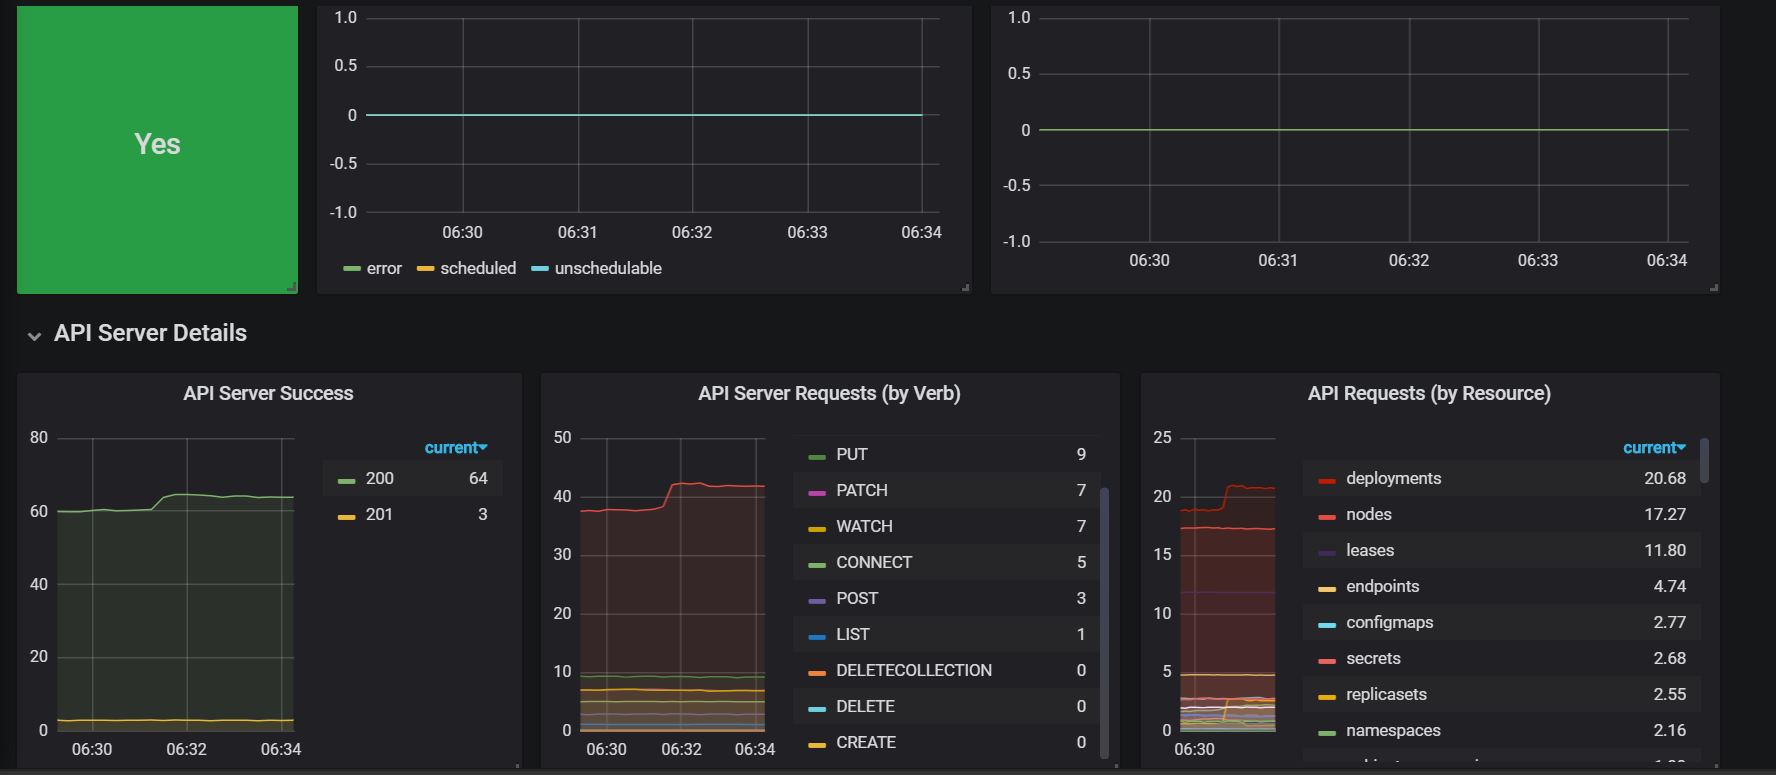
This dashboard monitors the health and performance of a Kubernetes control plane, focusing on API server load, request latency, and leadership status. It highlights key metrics such as apiserver_request_count and inflight requests, as well as latency distribution via apiserver_request_latencies_bucket and apiserver_request_duration_seconds_sum, to surface throughput, latency, and overall availability. It also tracks leadership and controller/scheduler activity, e.g., leader_election_master_status, deployment_depth, and volumes_depth to reveal control plane coordination and workload queuing dynamics.
Screenshots
Used Metrics 2626
apiserver_current_inflight_requests
apiserver_request_count
apiserver_request_duration_seconds_sum
apiserver_request_latencies_bucket
daemonset_adds
daemonset_depth
deployment_adds
deployment_depth
e
endpoint_adds
endpoint_depth
horizontalpodautoscaler_adds
horizontalpodautoscaler_depth
leader_election_master_status
replicaset_adds
replicaset_depth
replicationmanager_depth
scheduler_e2e_scheduling_duration_seconds_sum
scheduler_schedule_attempts_total
service_adds
service_depth
serviceaccount_depth
statefulset_adds
statefulset_depth
volumes_adds
volumes_depth