K8/Openshift Projects 65,30665,306
10/1/2018
10/3/2018
4
>=5.2.1
Prometheus
Description
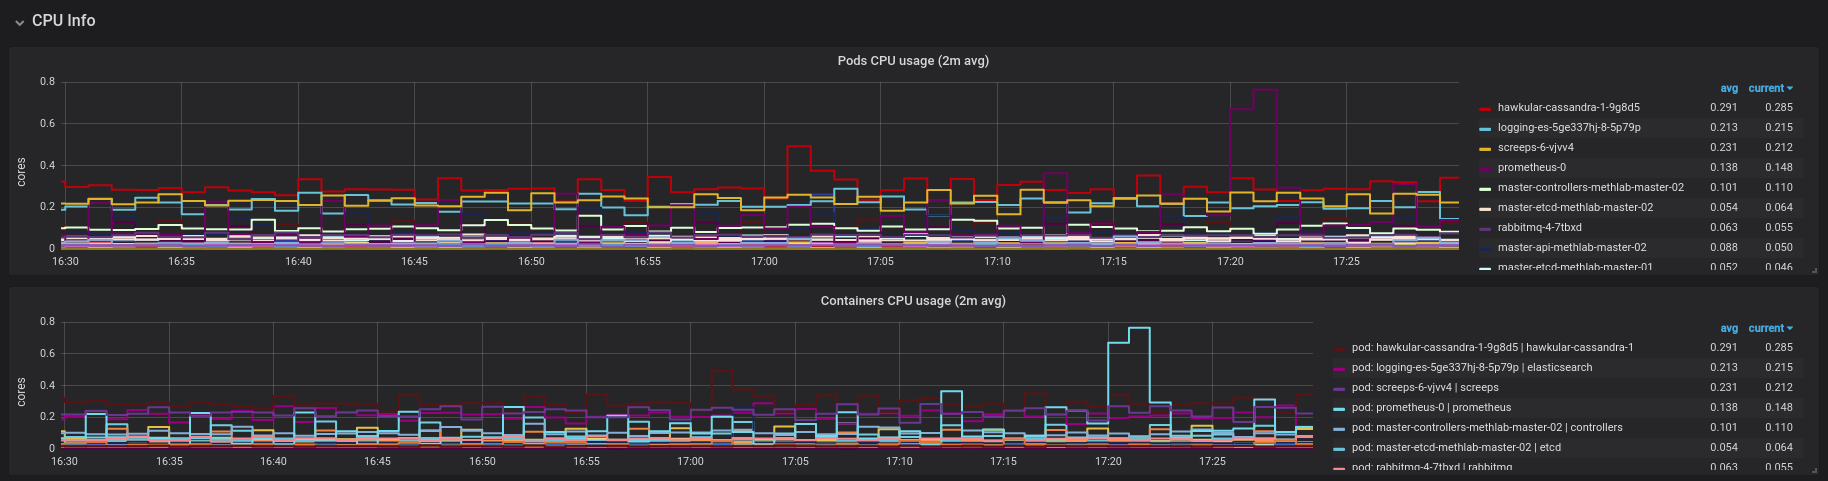
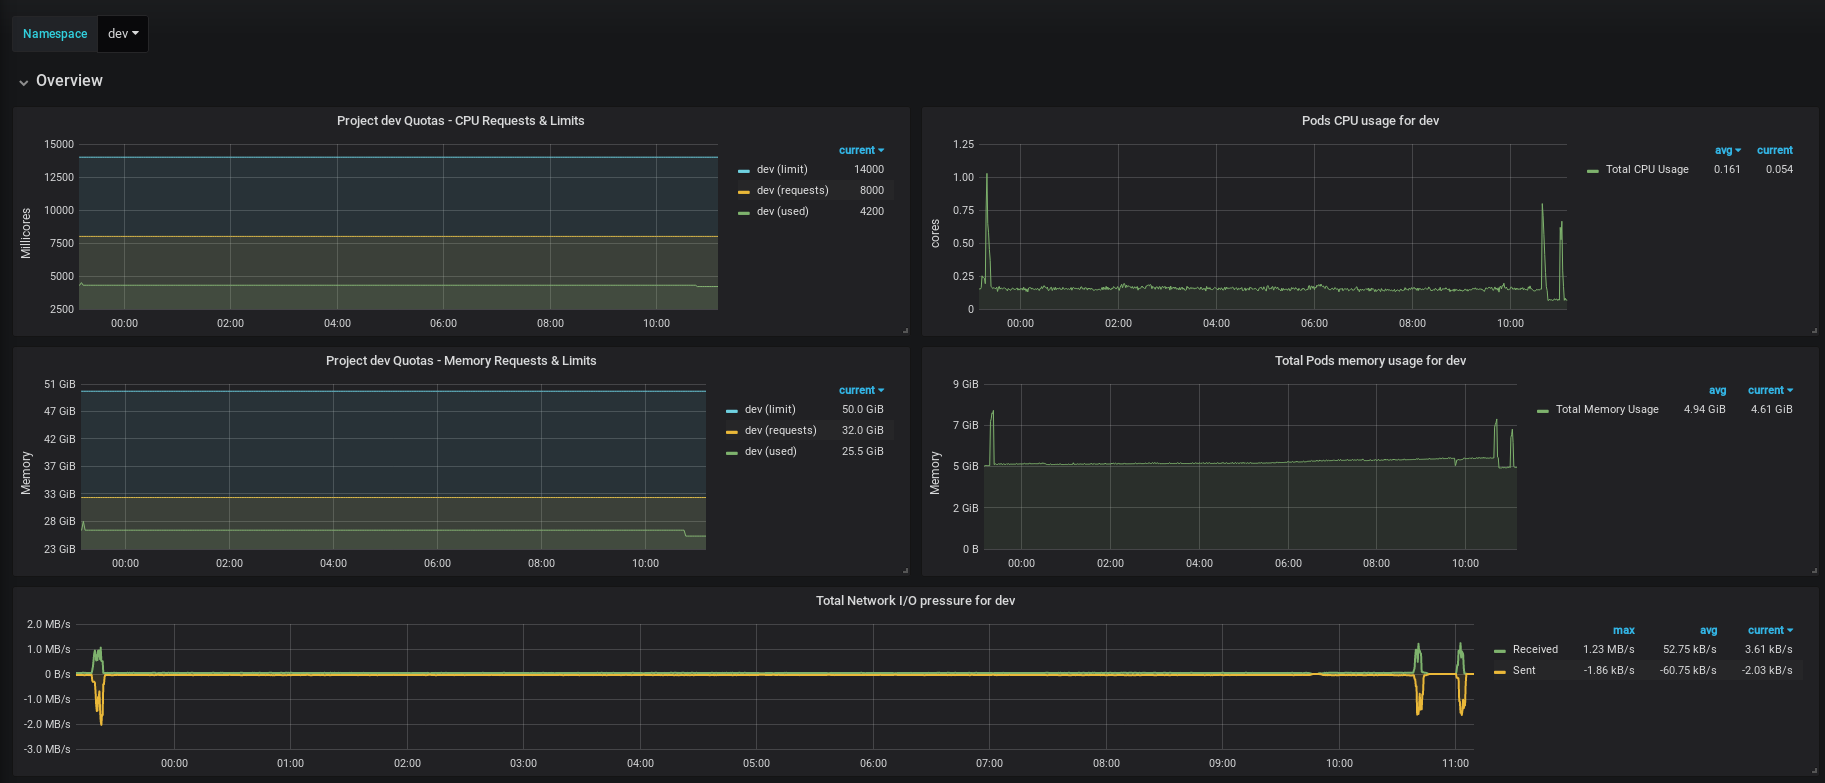
This dashboard monitors Kubernetes/OpenShift namespace resource usage and limits, focusing on per-namespace quotas and real-time consumption. It highlights CPU and memory quotas via kube_resourcequota, per-pod CPU usage with container_cpu_usage_seconds_total, and network I/O pressure using container_network_receive_bytes_total and container_network_transmit_bytes_total. Overall, it provides visibility into capacity versus consumption and potential bottlenecks across namespaces.
Screenshots
Used Metrics 55
Get Dashboard✕
Download
Copy to Clipboard