K8 Cluster Detail Dashboard 94,47694,476 4.0 (1 reviews)
9/13/2019
9/13/2019
1
>=6.2.5
Prometheus
Description
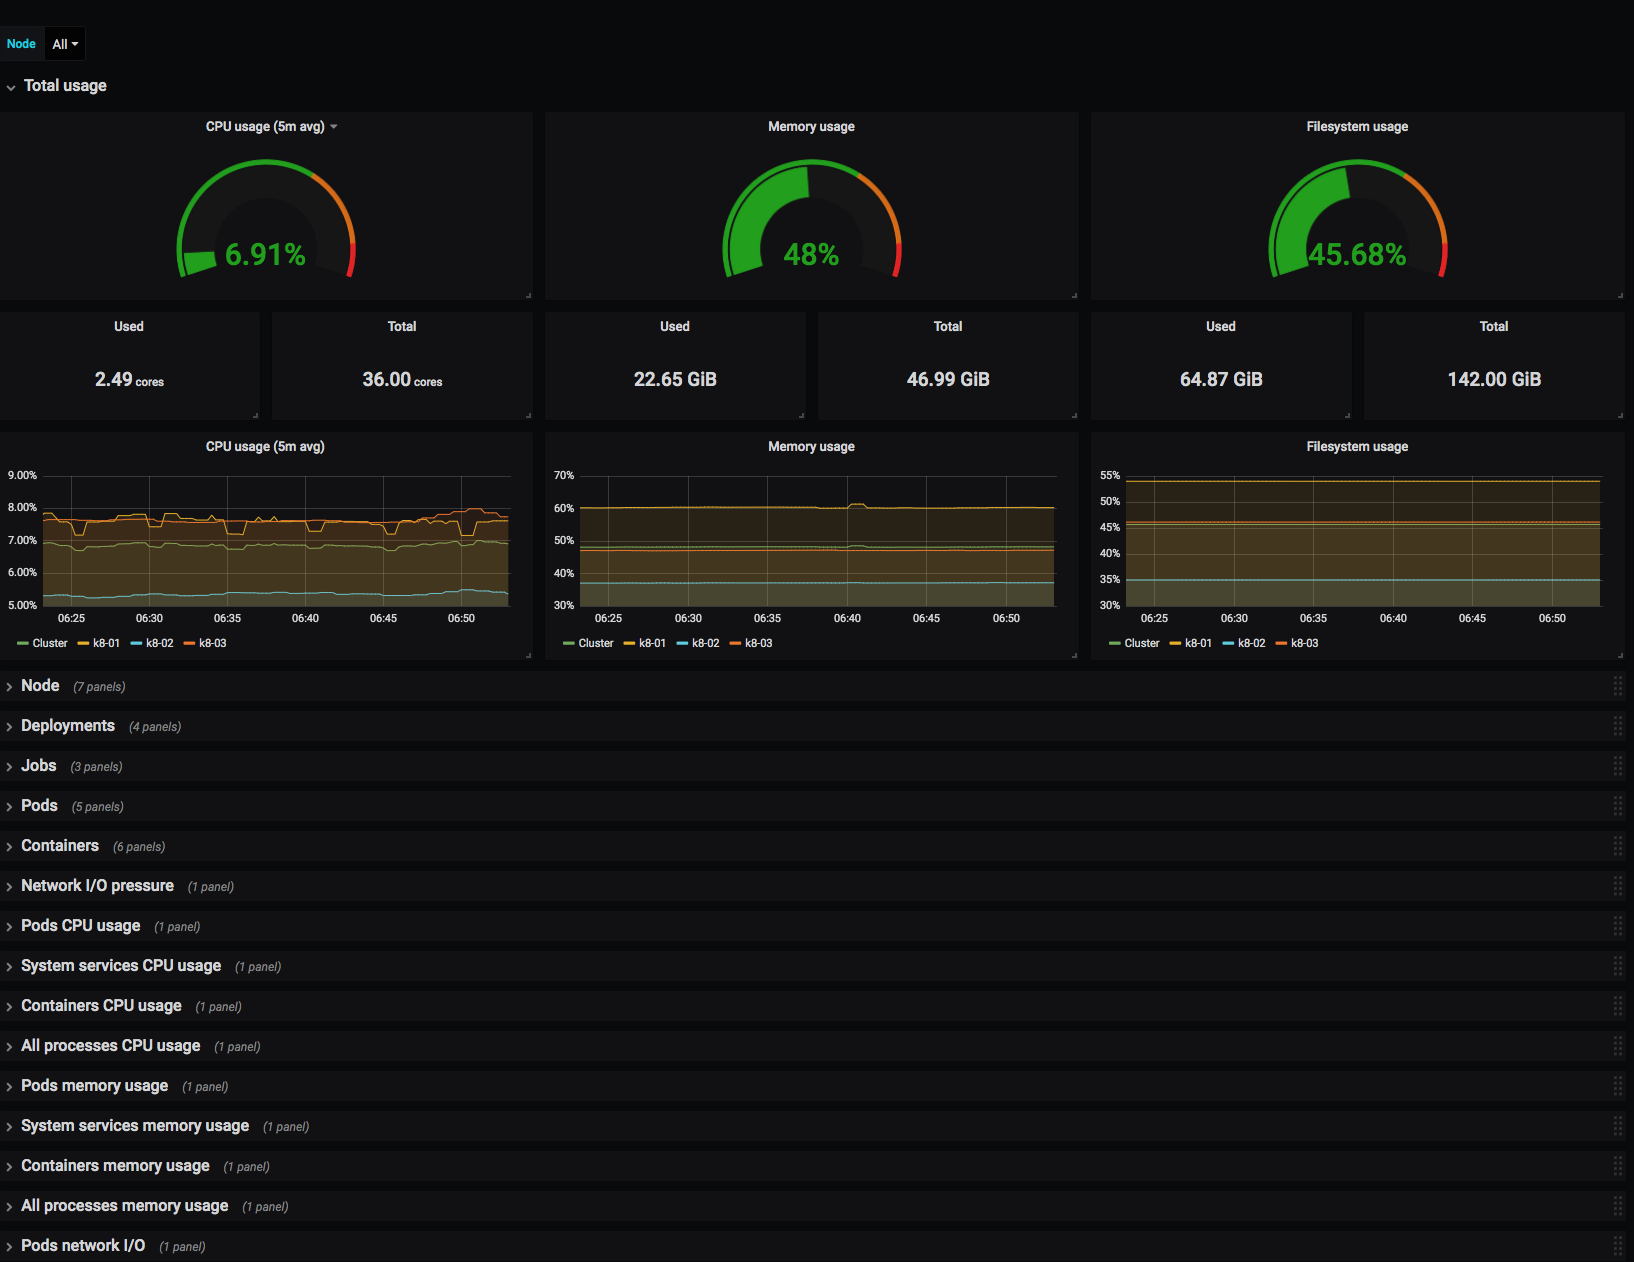
Monitors resource utilization of Kubernetes nodes, focusing on CPU, memory, and filesystem metrics to assess node health and capacity. Key features include 5-minute average CPU usage with container_cpu_usage_seconds_total and memory metrics from machine_memory_bytes and container_memory_working_set_bytes, plus filesystem usage tracked via container_fs_usage_bytes and container_fs_limit_bytes to flag potential bottlenecks before capacity limits are hit.
Screenshots
Get Dashboard✕
Download
Copy to Clipboard