k6 Prometheus (Native Histograms) 1,043,9441,043,944 5.0 (3 reviews)
Description
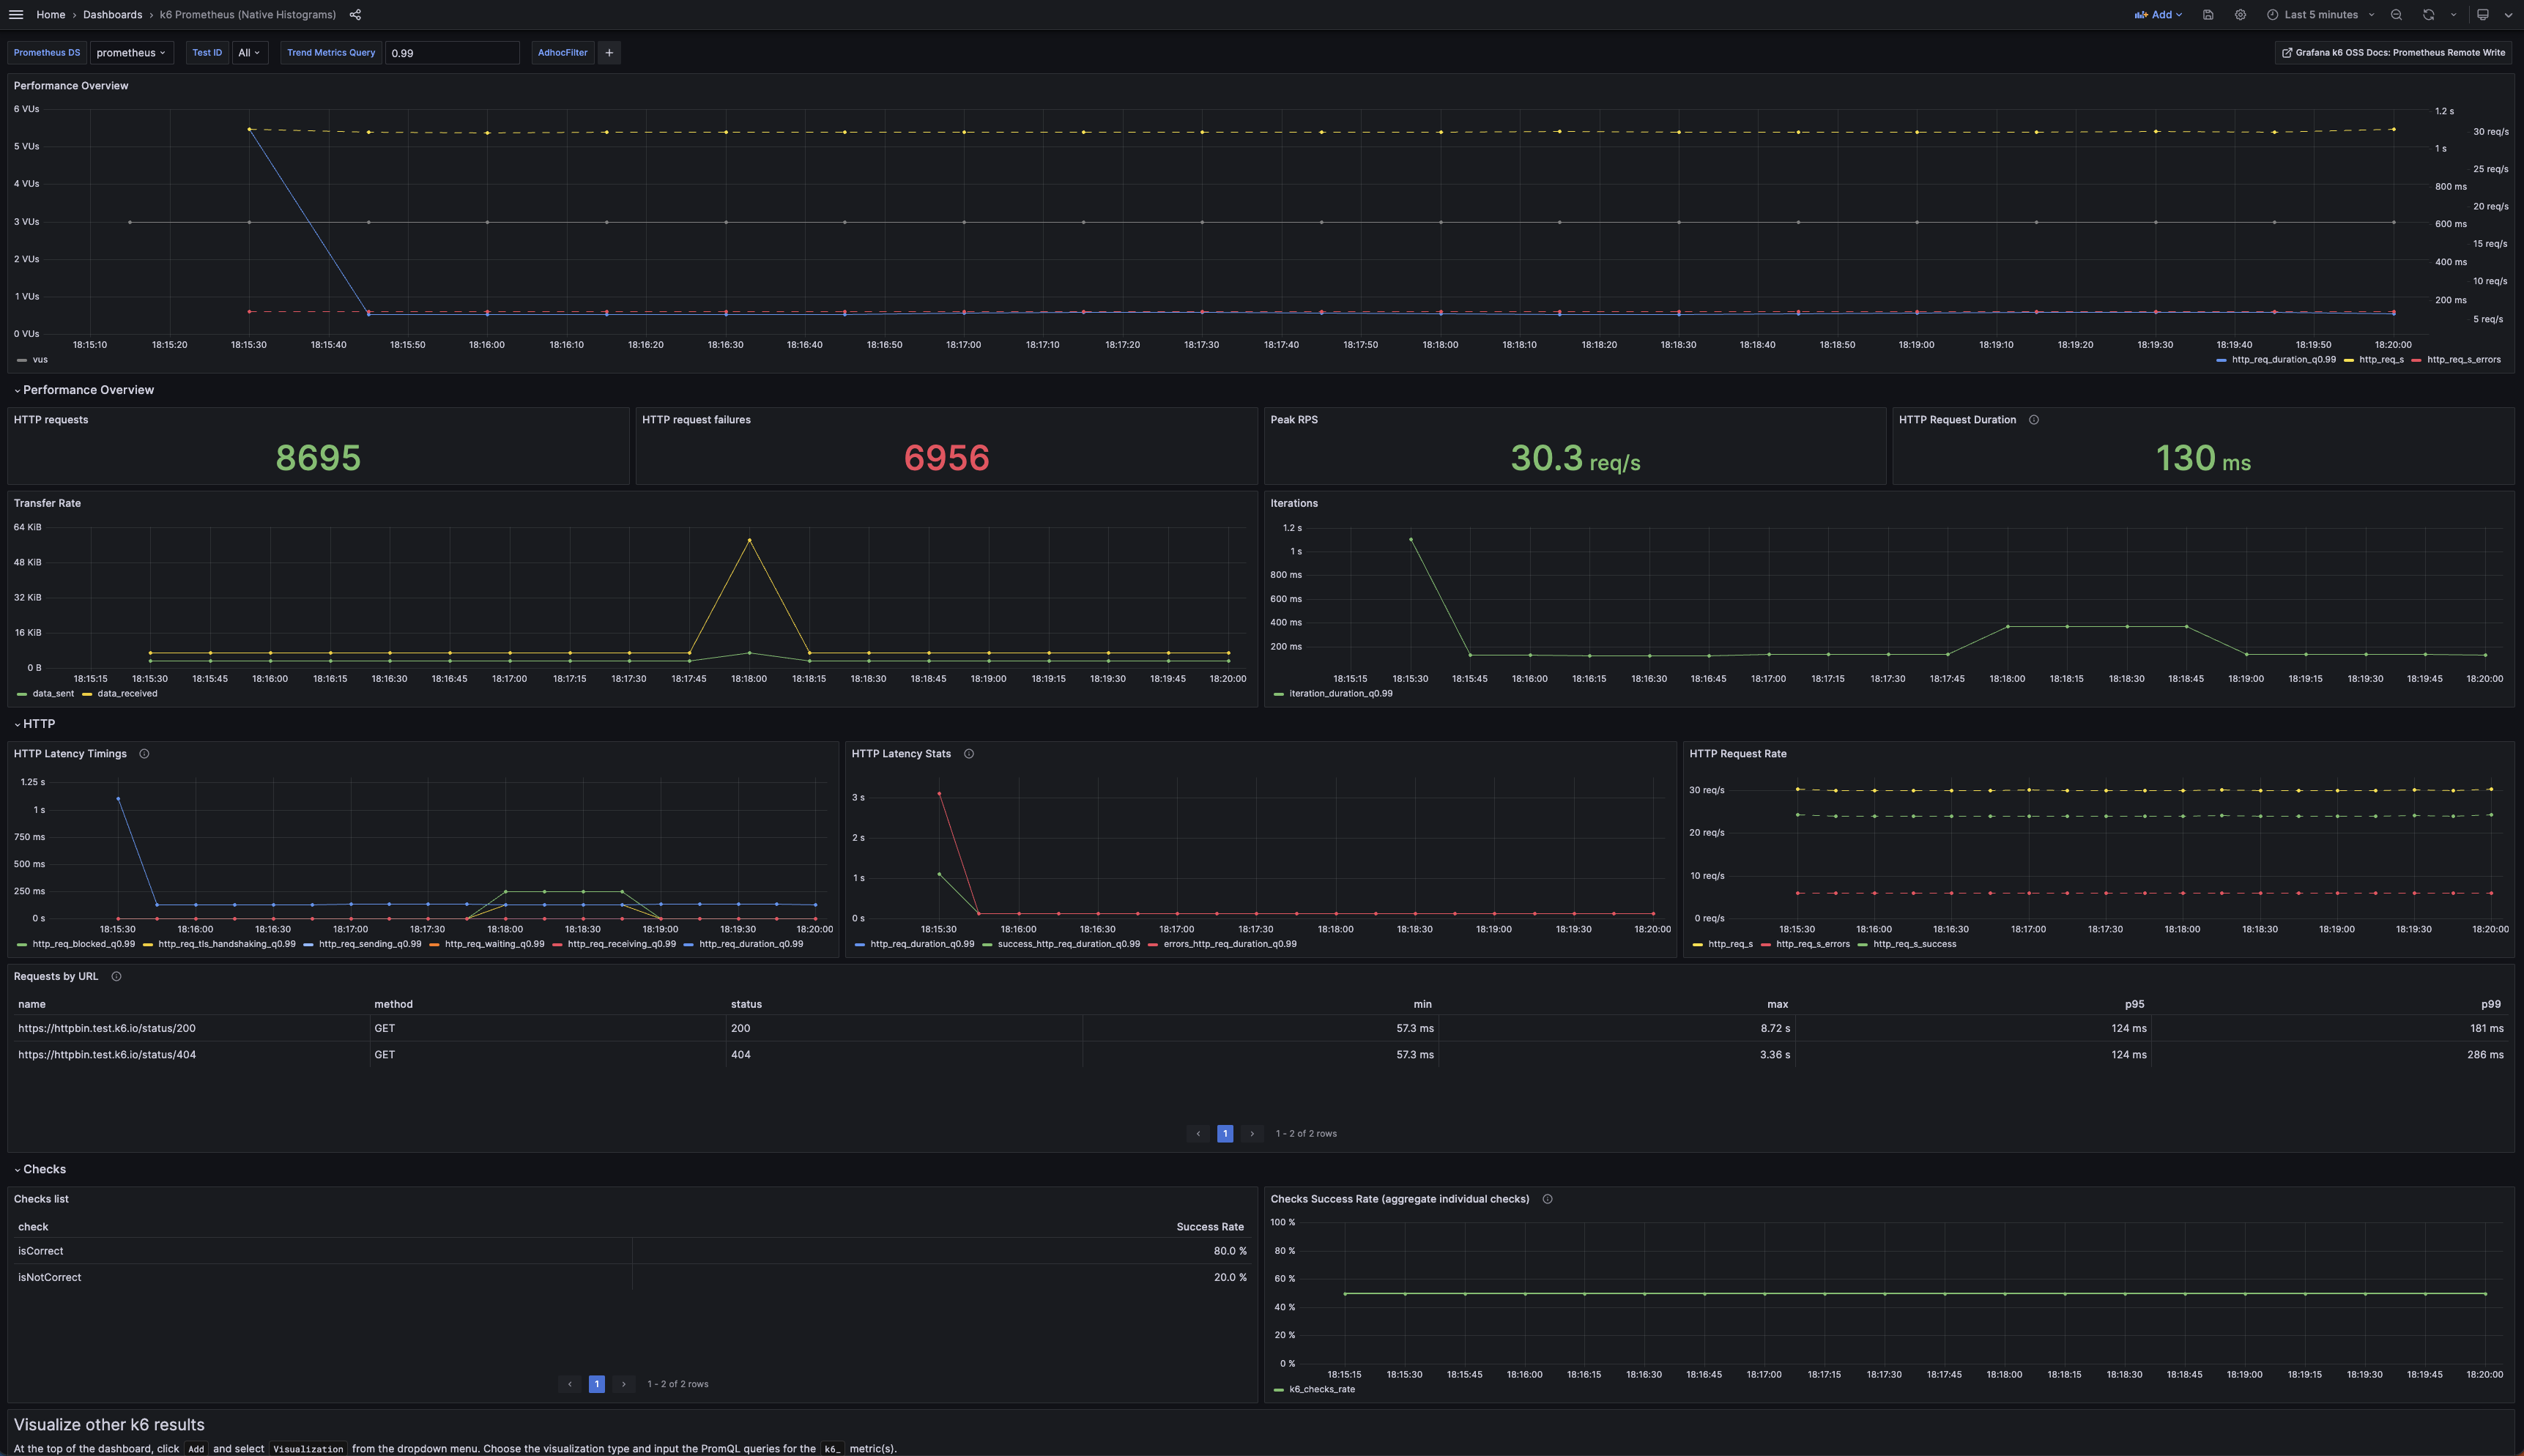
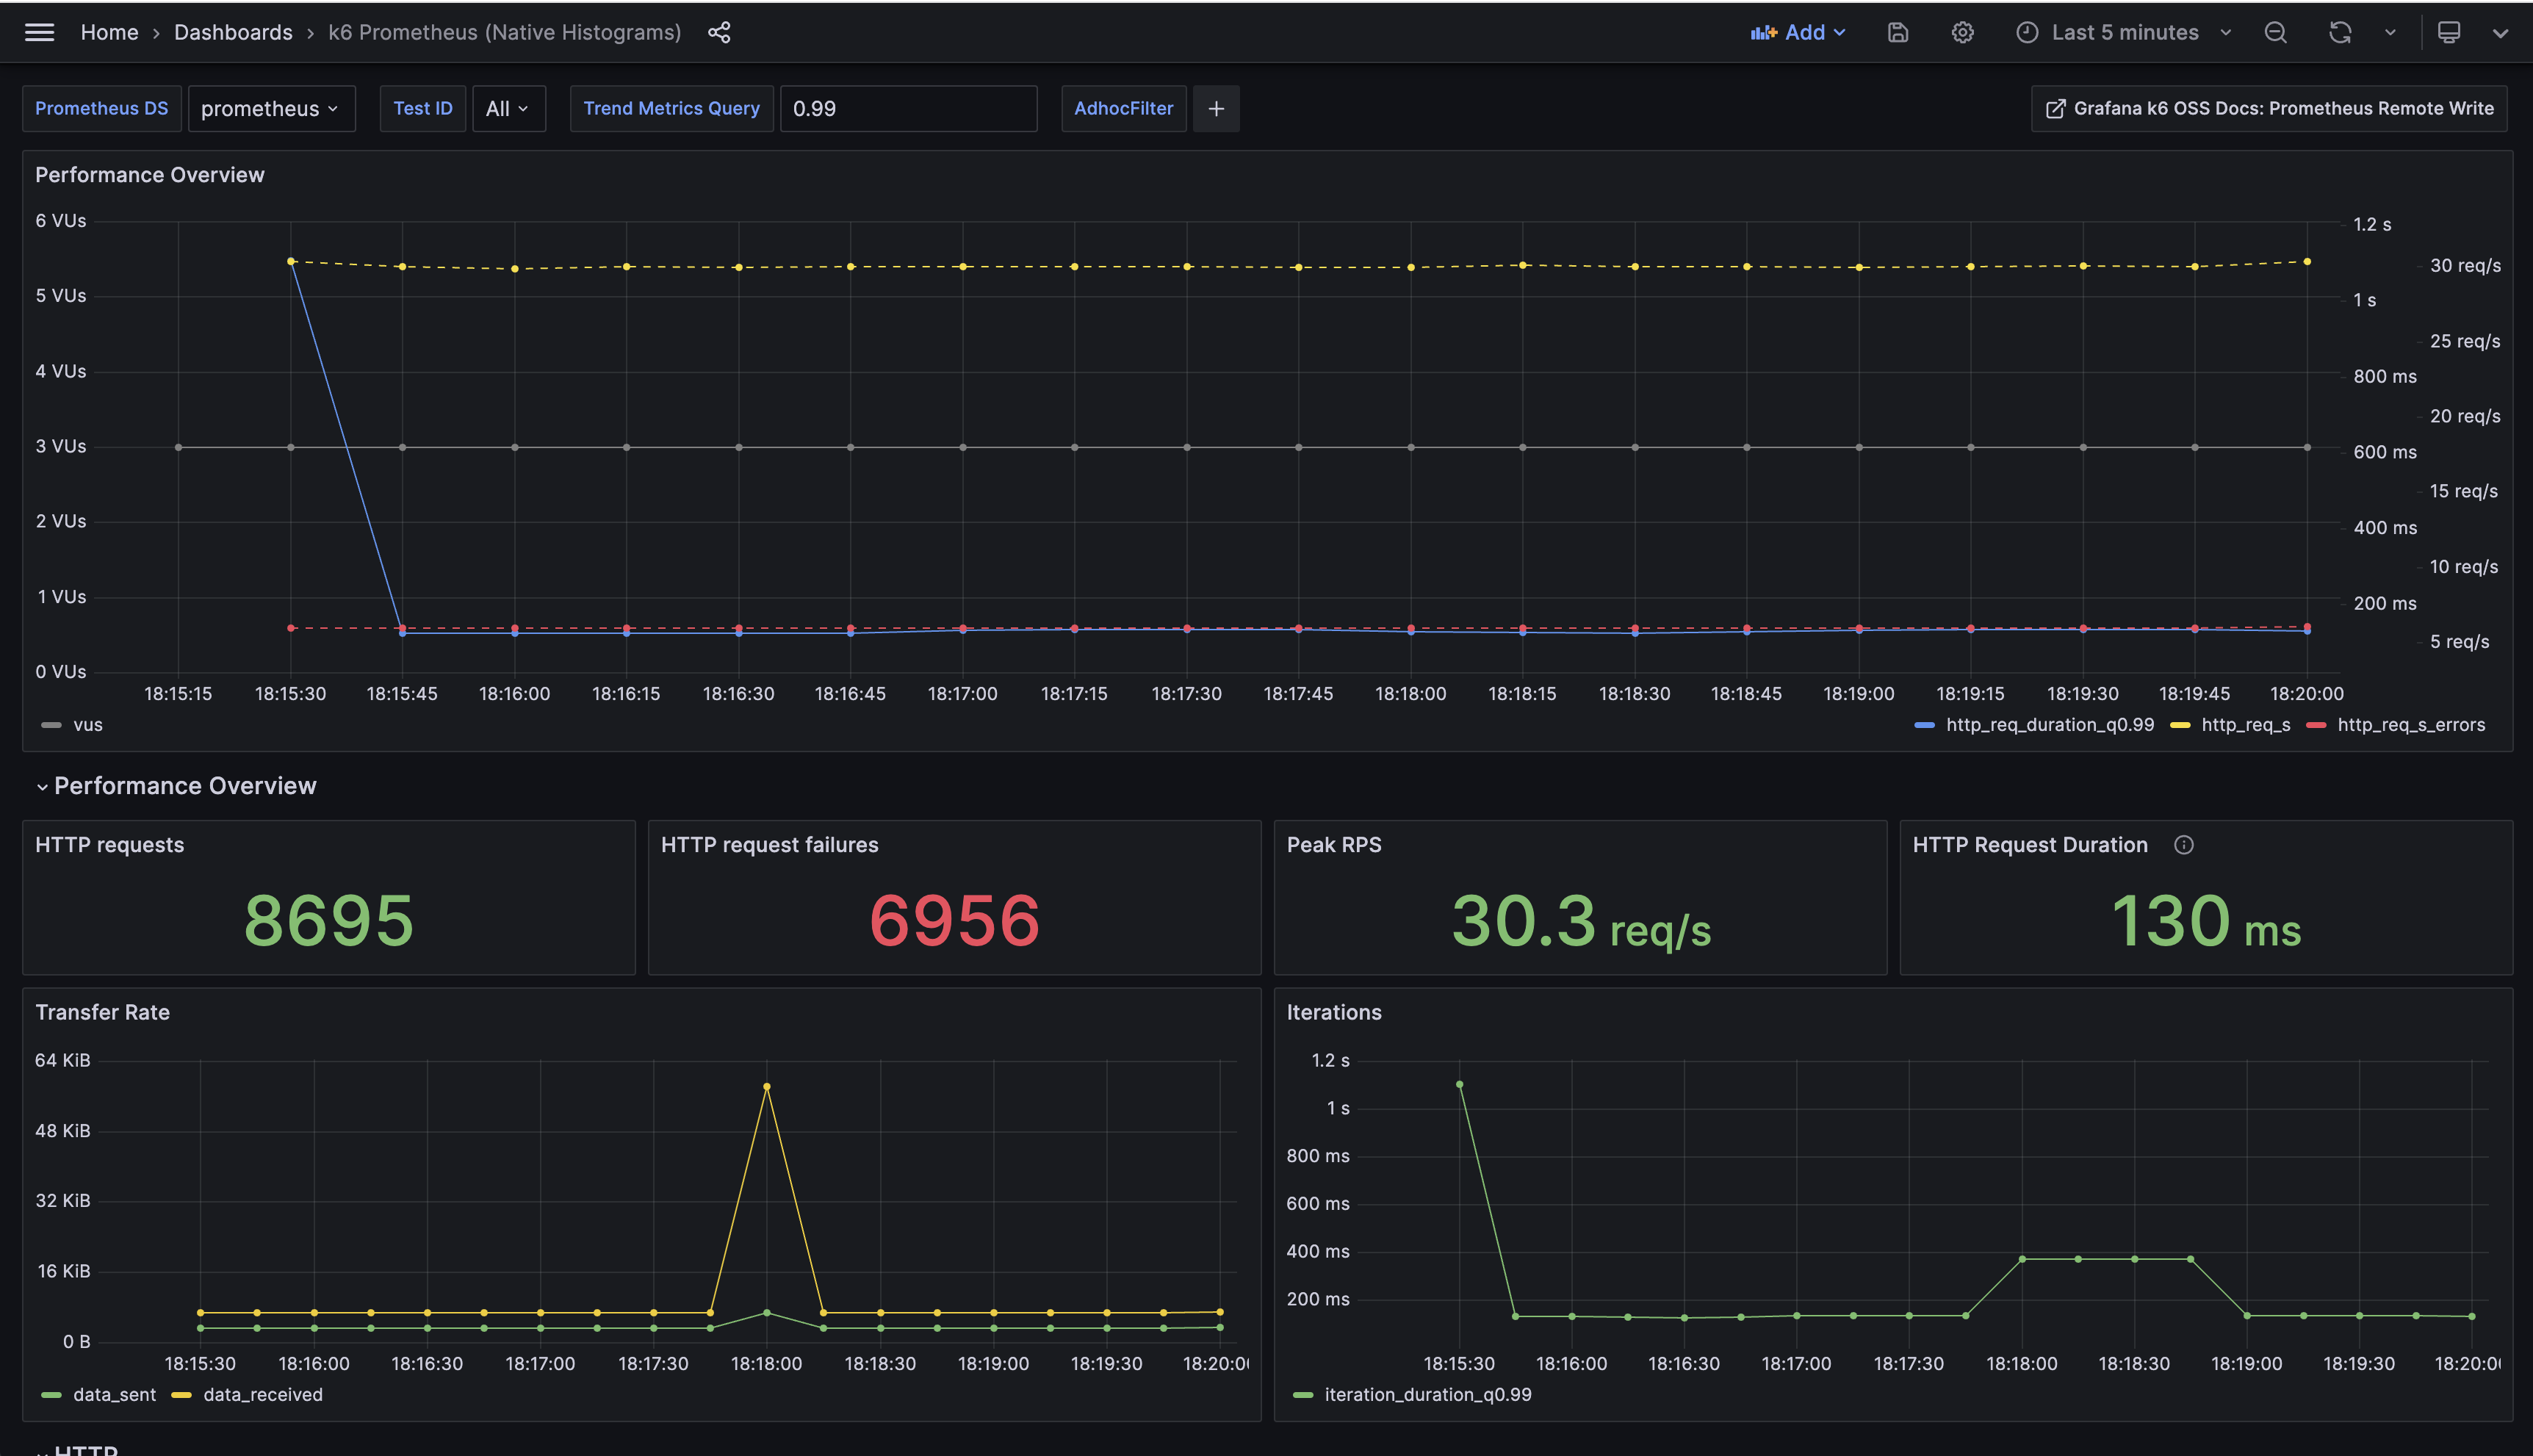
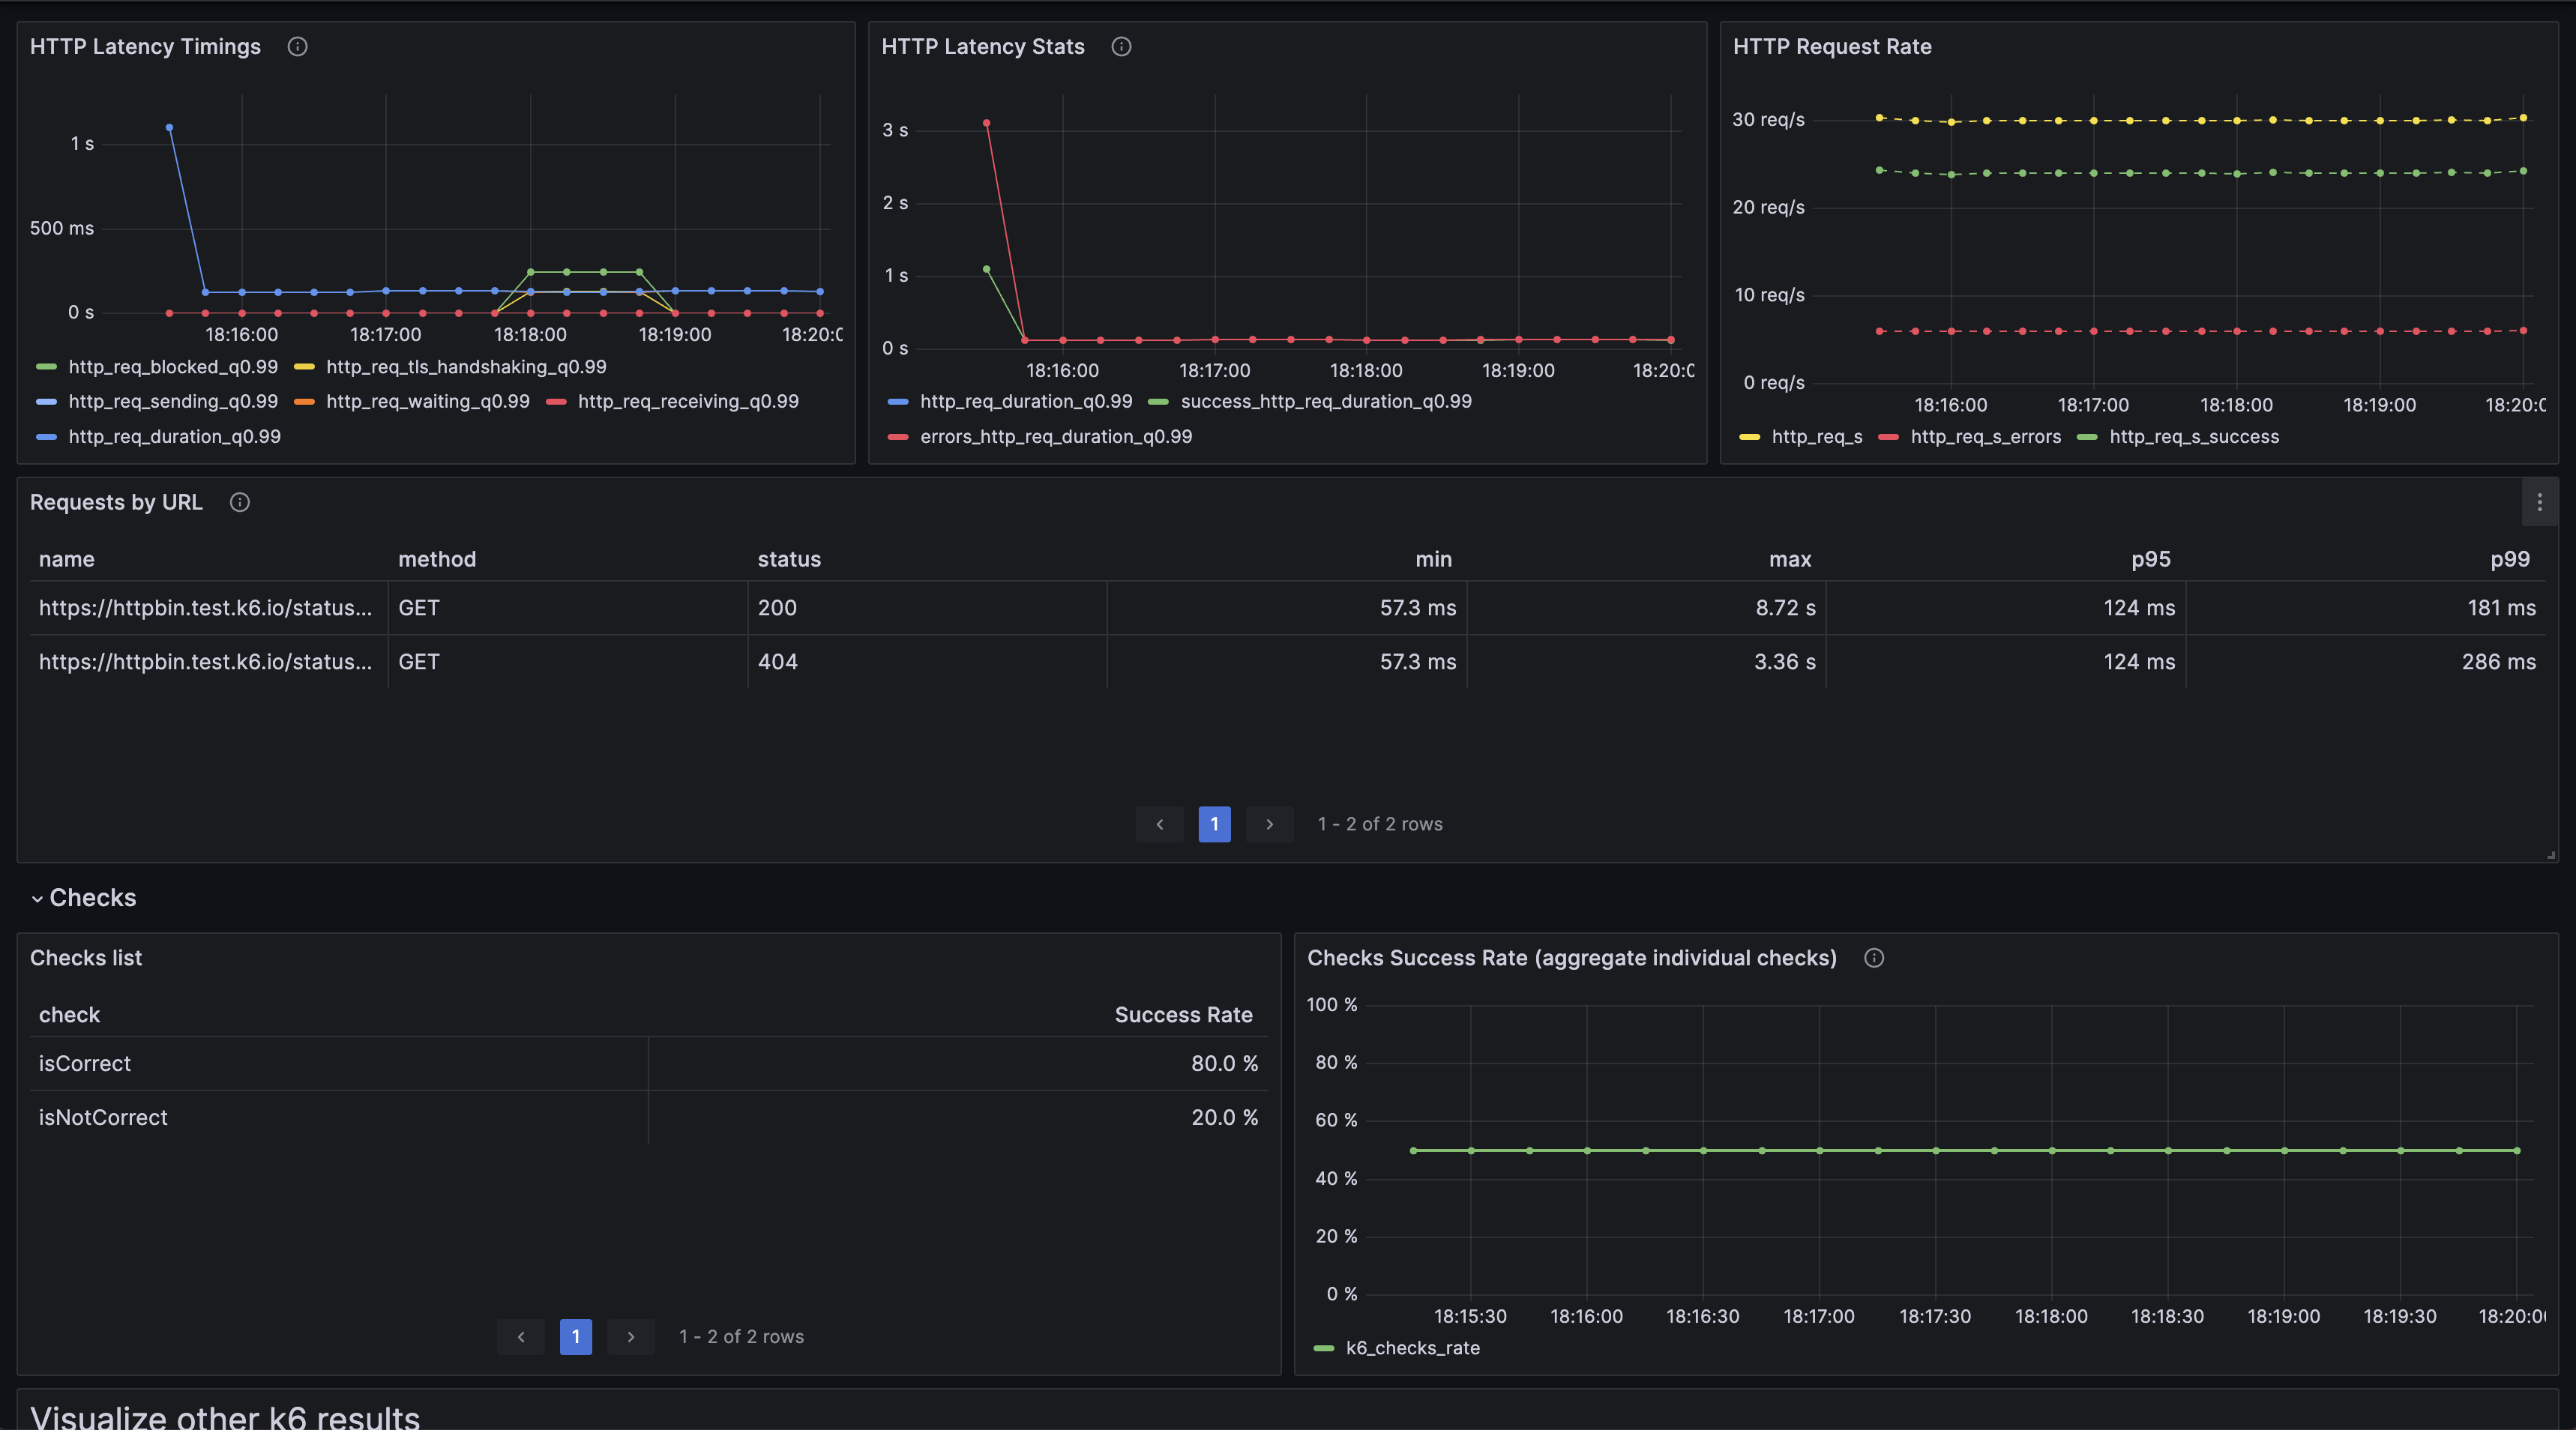
This dashboard visualizes high-cardinality Prometheus metrics from k6 to monitor load test performance across HTTP requests, latency, and throughput. It emphasizes histogram-based timing with metrics such as k6_http_req_duration_seconds (latency distribution), k6_http_reqs_total and k6_http_req_failed_rate (requests and failure rate), and k6_iteration_duration_seconds (per-iteration timing) to provide granular insights into latency, success rate, and throughput. Additional panels cover peak RPS, data transfer, and request-by-URL breakdown, enabling rapid diagnosis of bottlenecks and test stability.
Screenshots
Used Metrics 1515
k6_checks_rate
k6_data_received_total
k6_data_sent_total
k6_dropped_iterations_total
k6_http_req_blocked_seconds
k6_http_req_duration_seconds
k6_http_req_failed_rate
k6_http_req_receiving_seconds
k6_http_req_sending_seconds
k6_http_req_tls_handshaking_seconds
k6_http_req_waiting_seconds
k6_http_reqs_total
k6_iteration_duration_seconds
k6_vus
quantile