k6 Prometheus 54,85054,850
Description
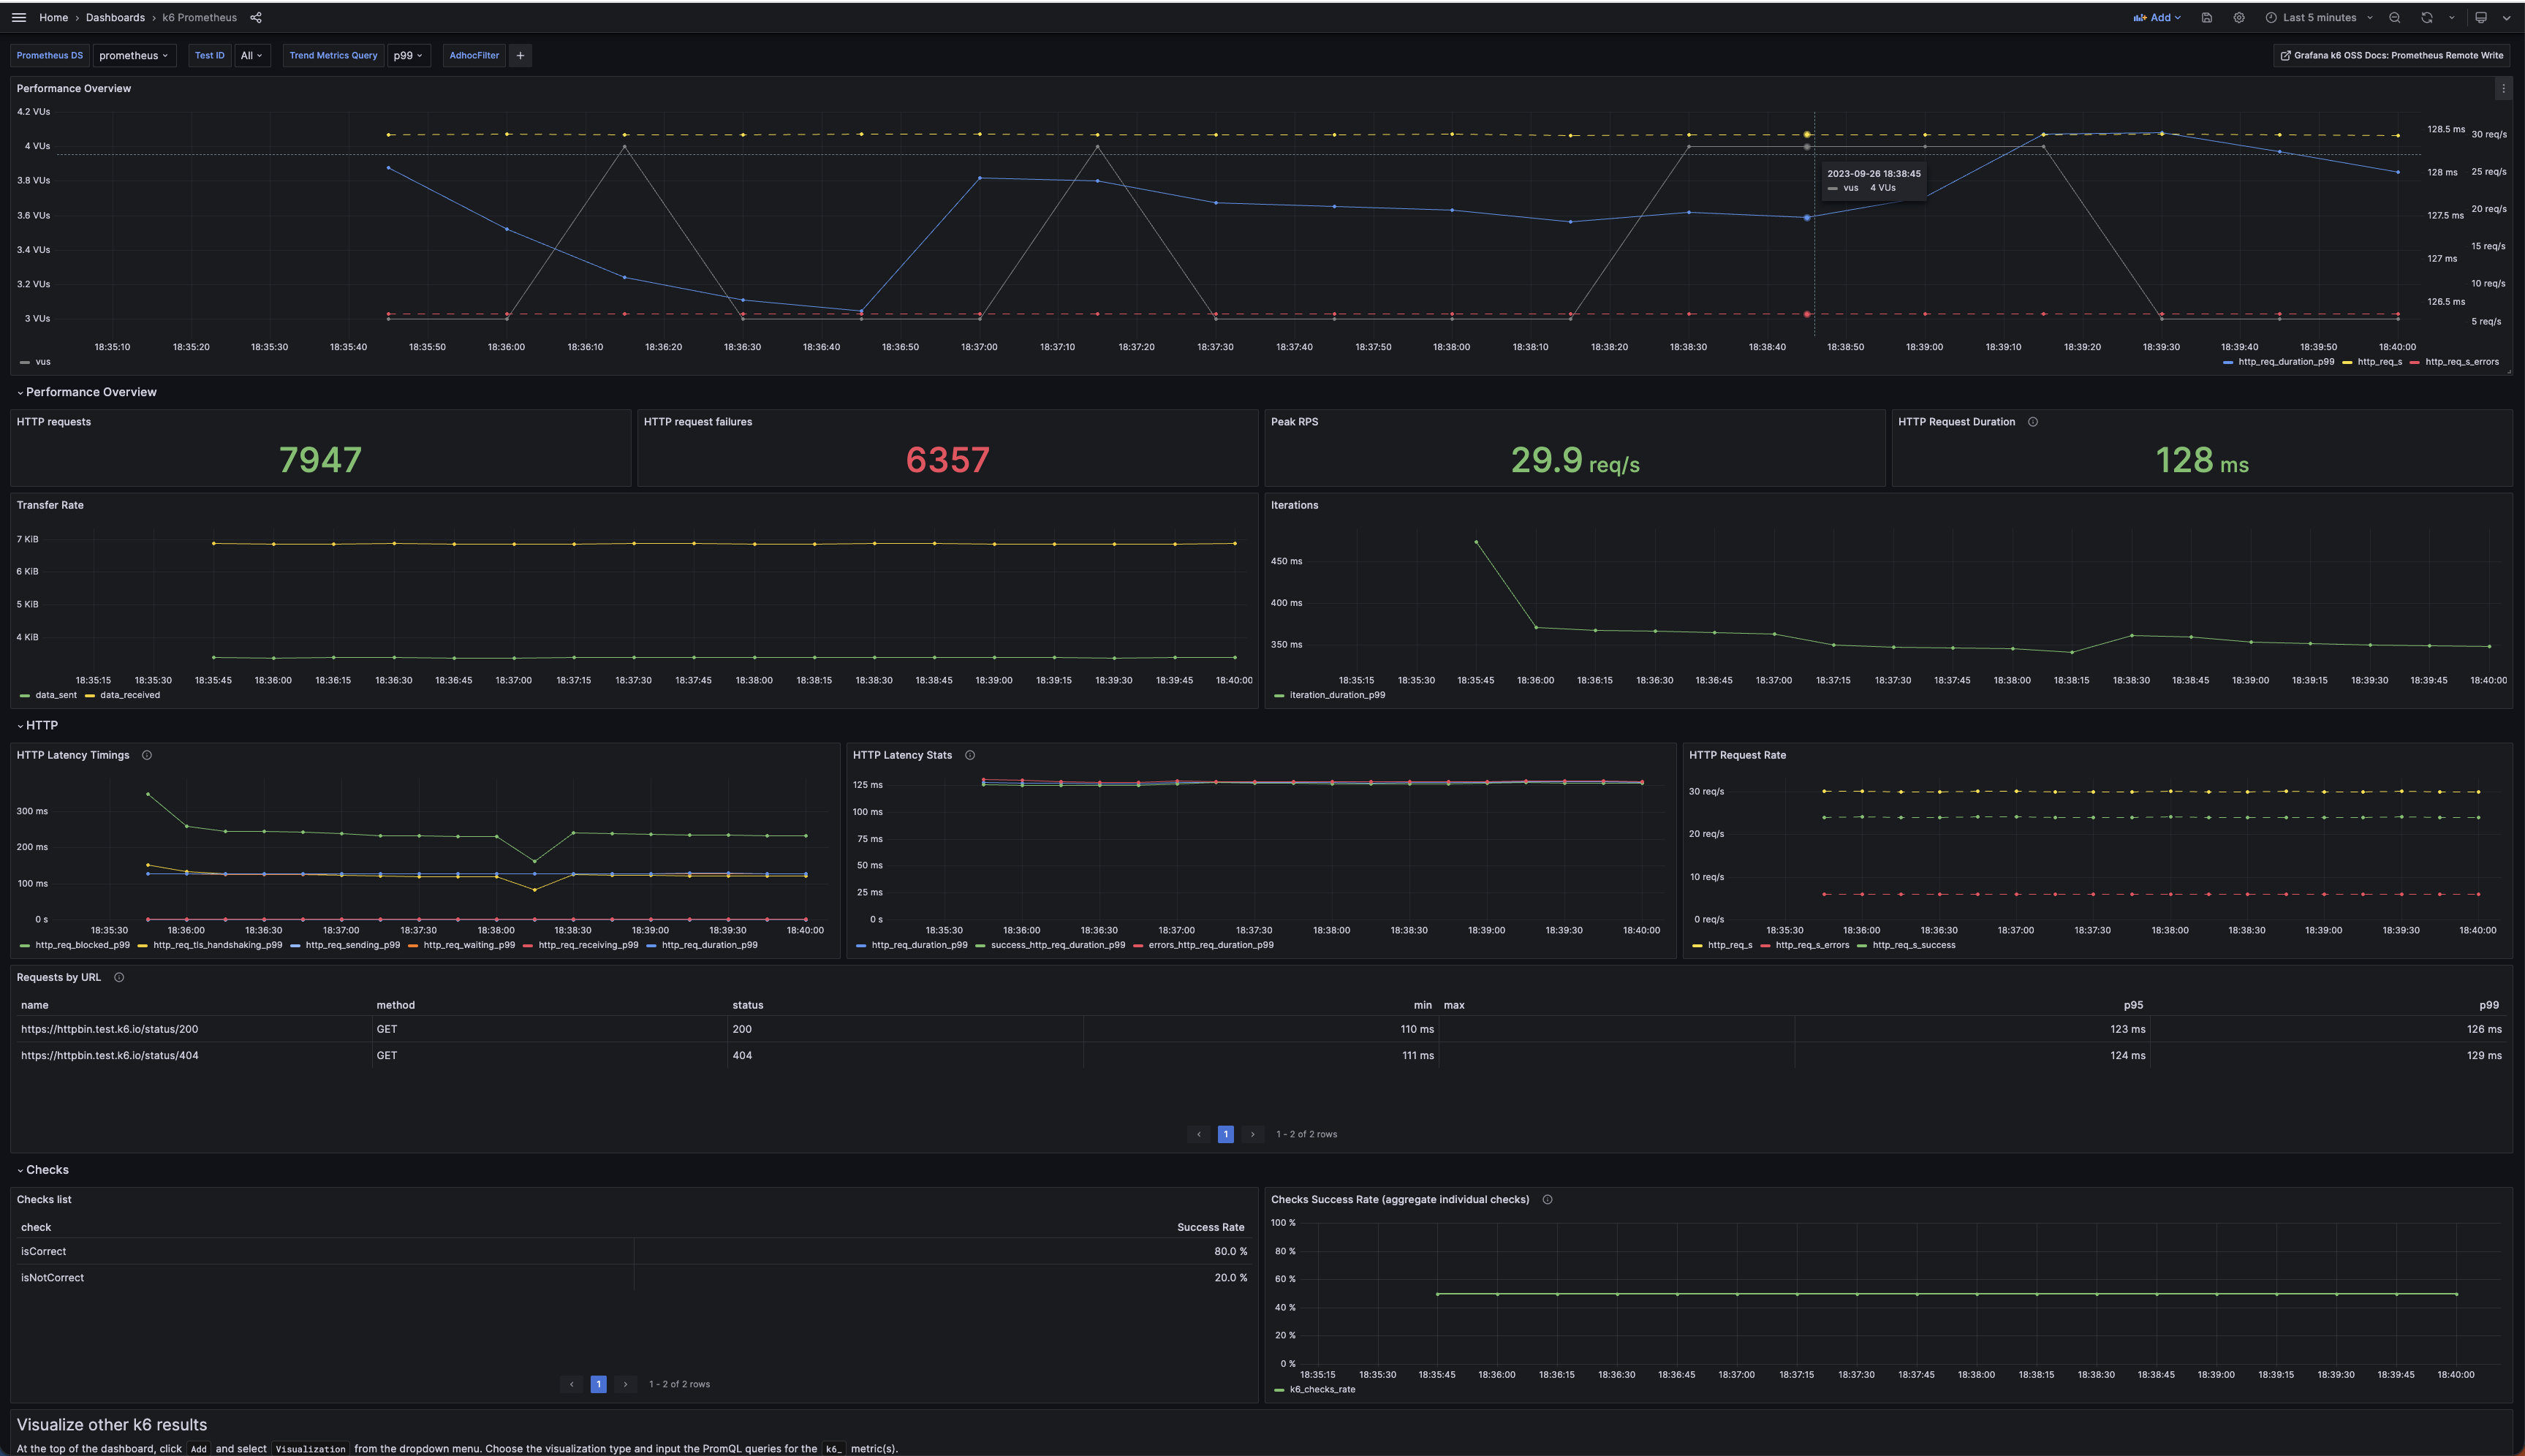
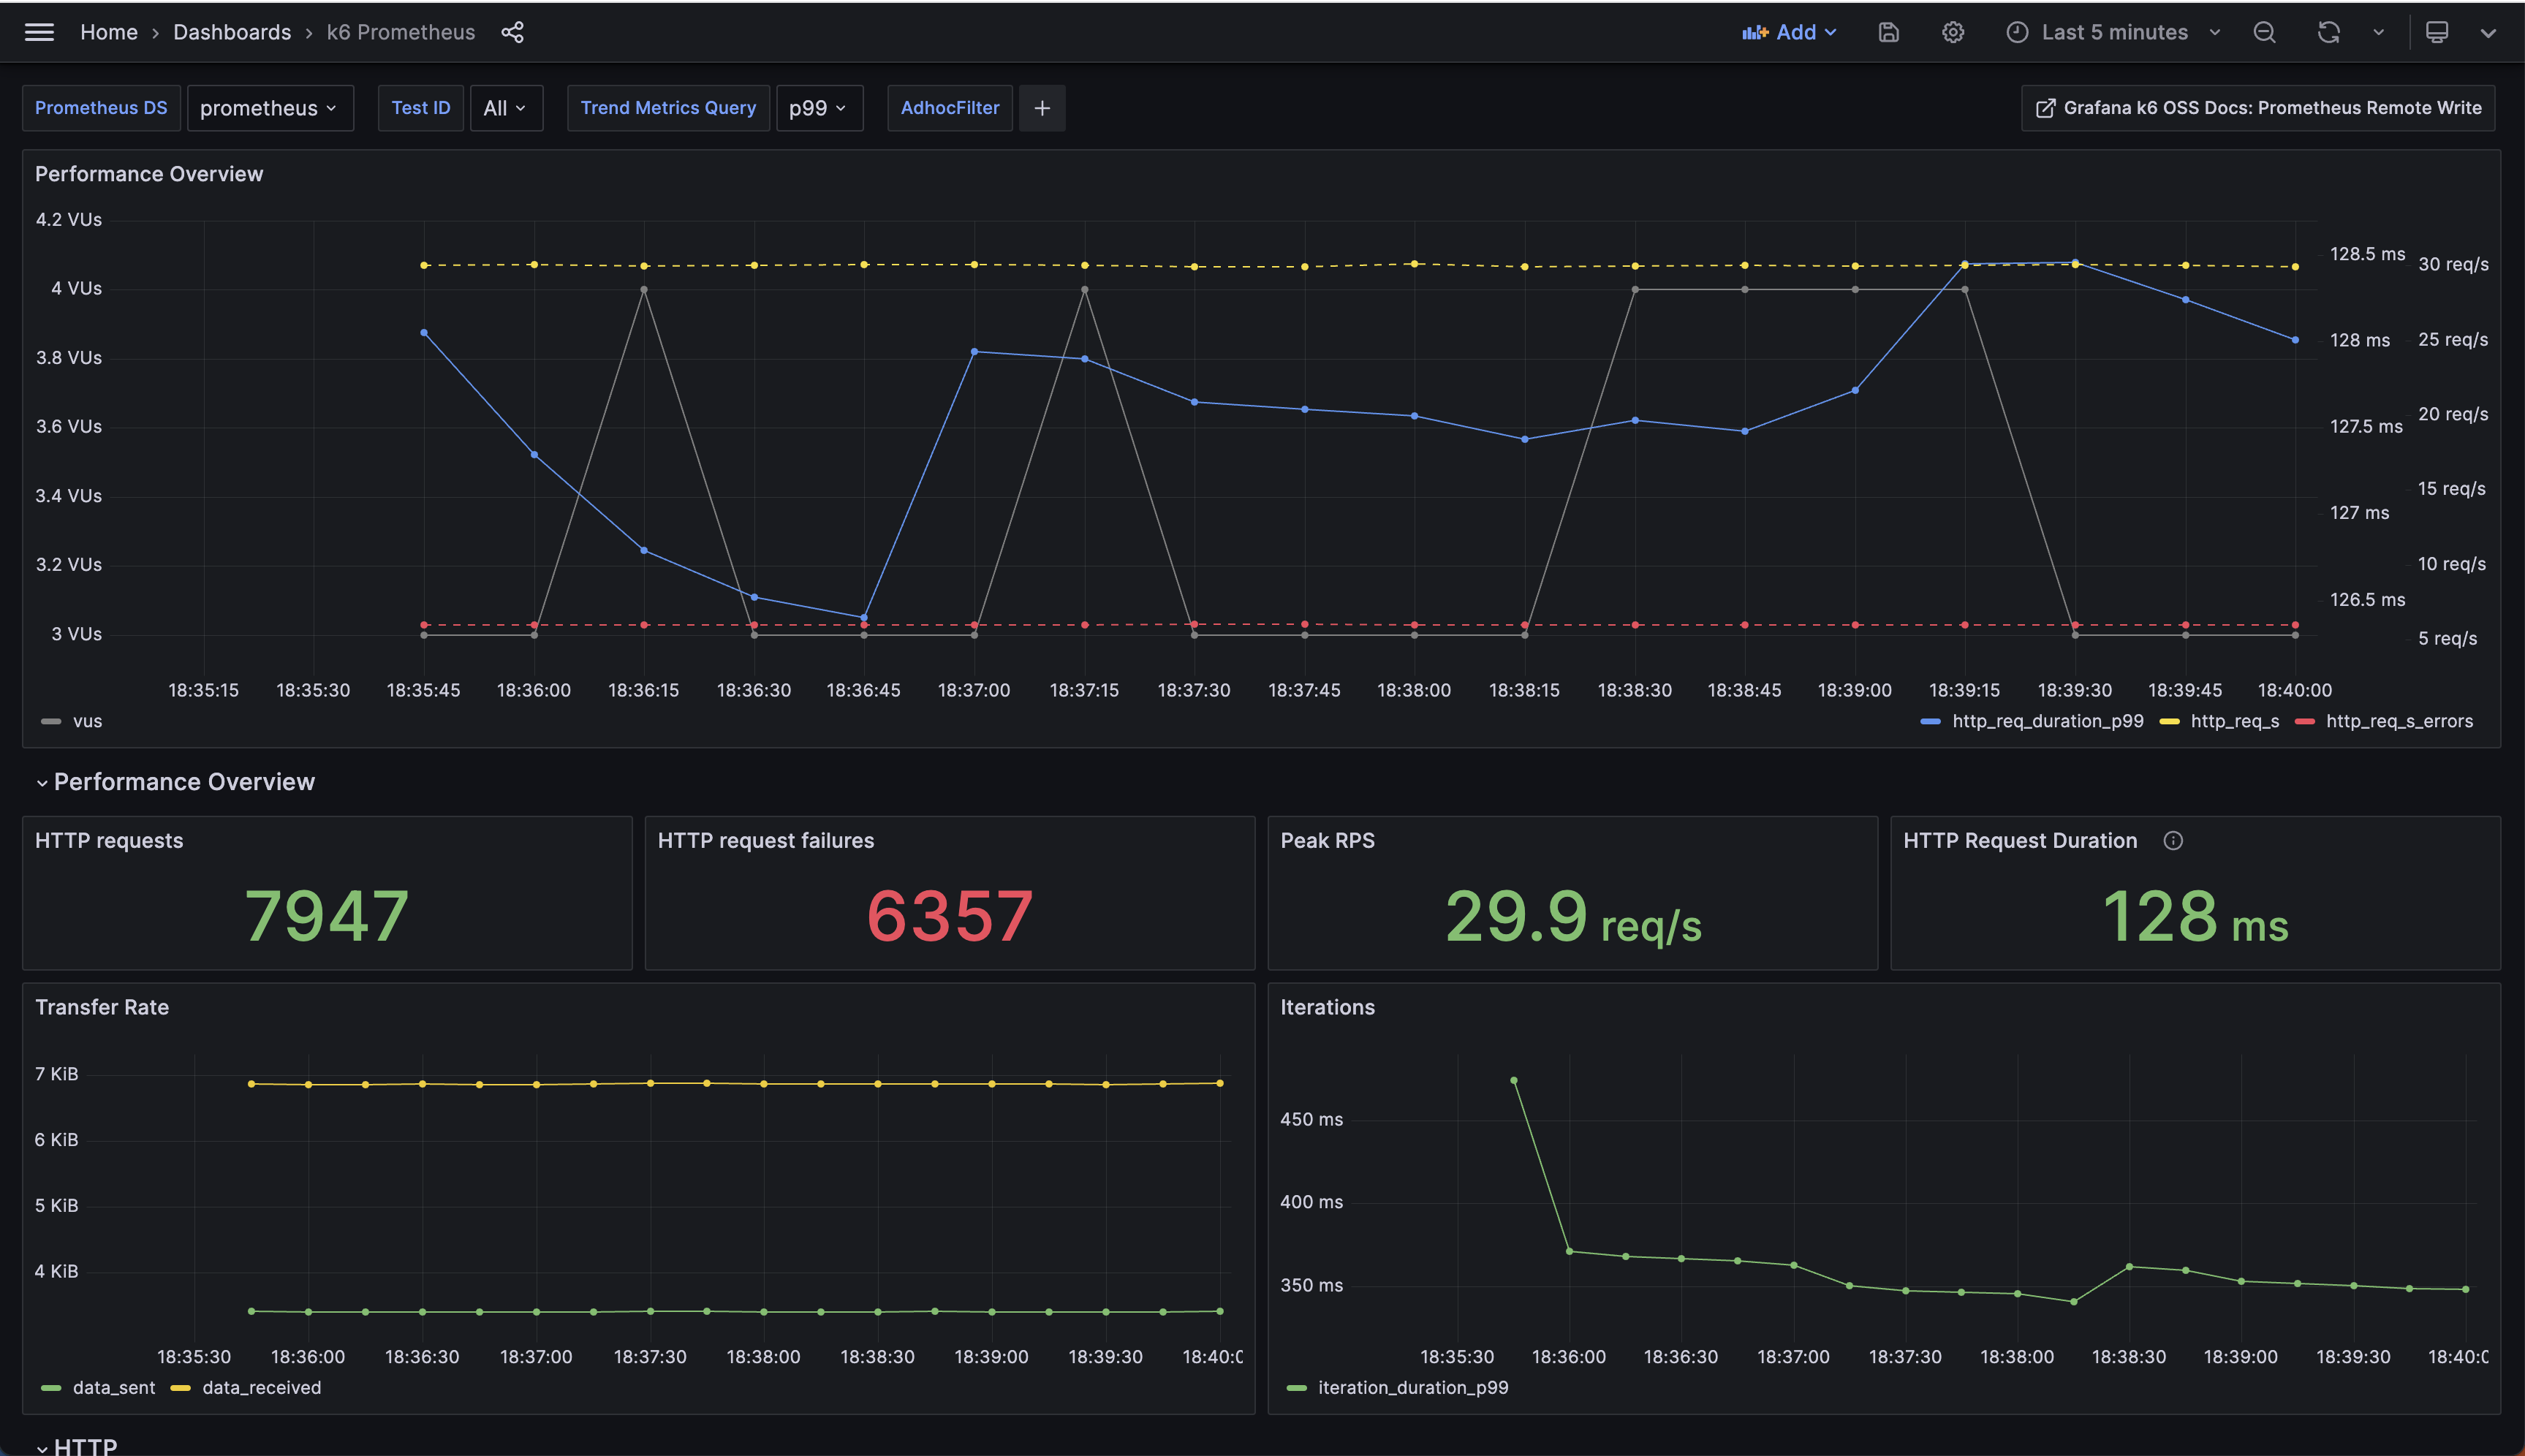
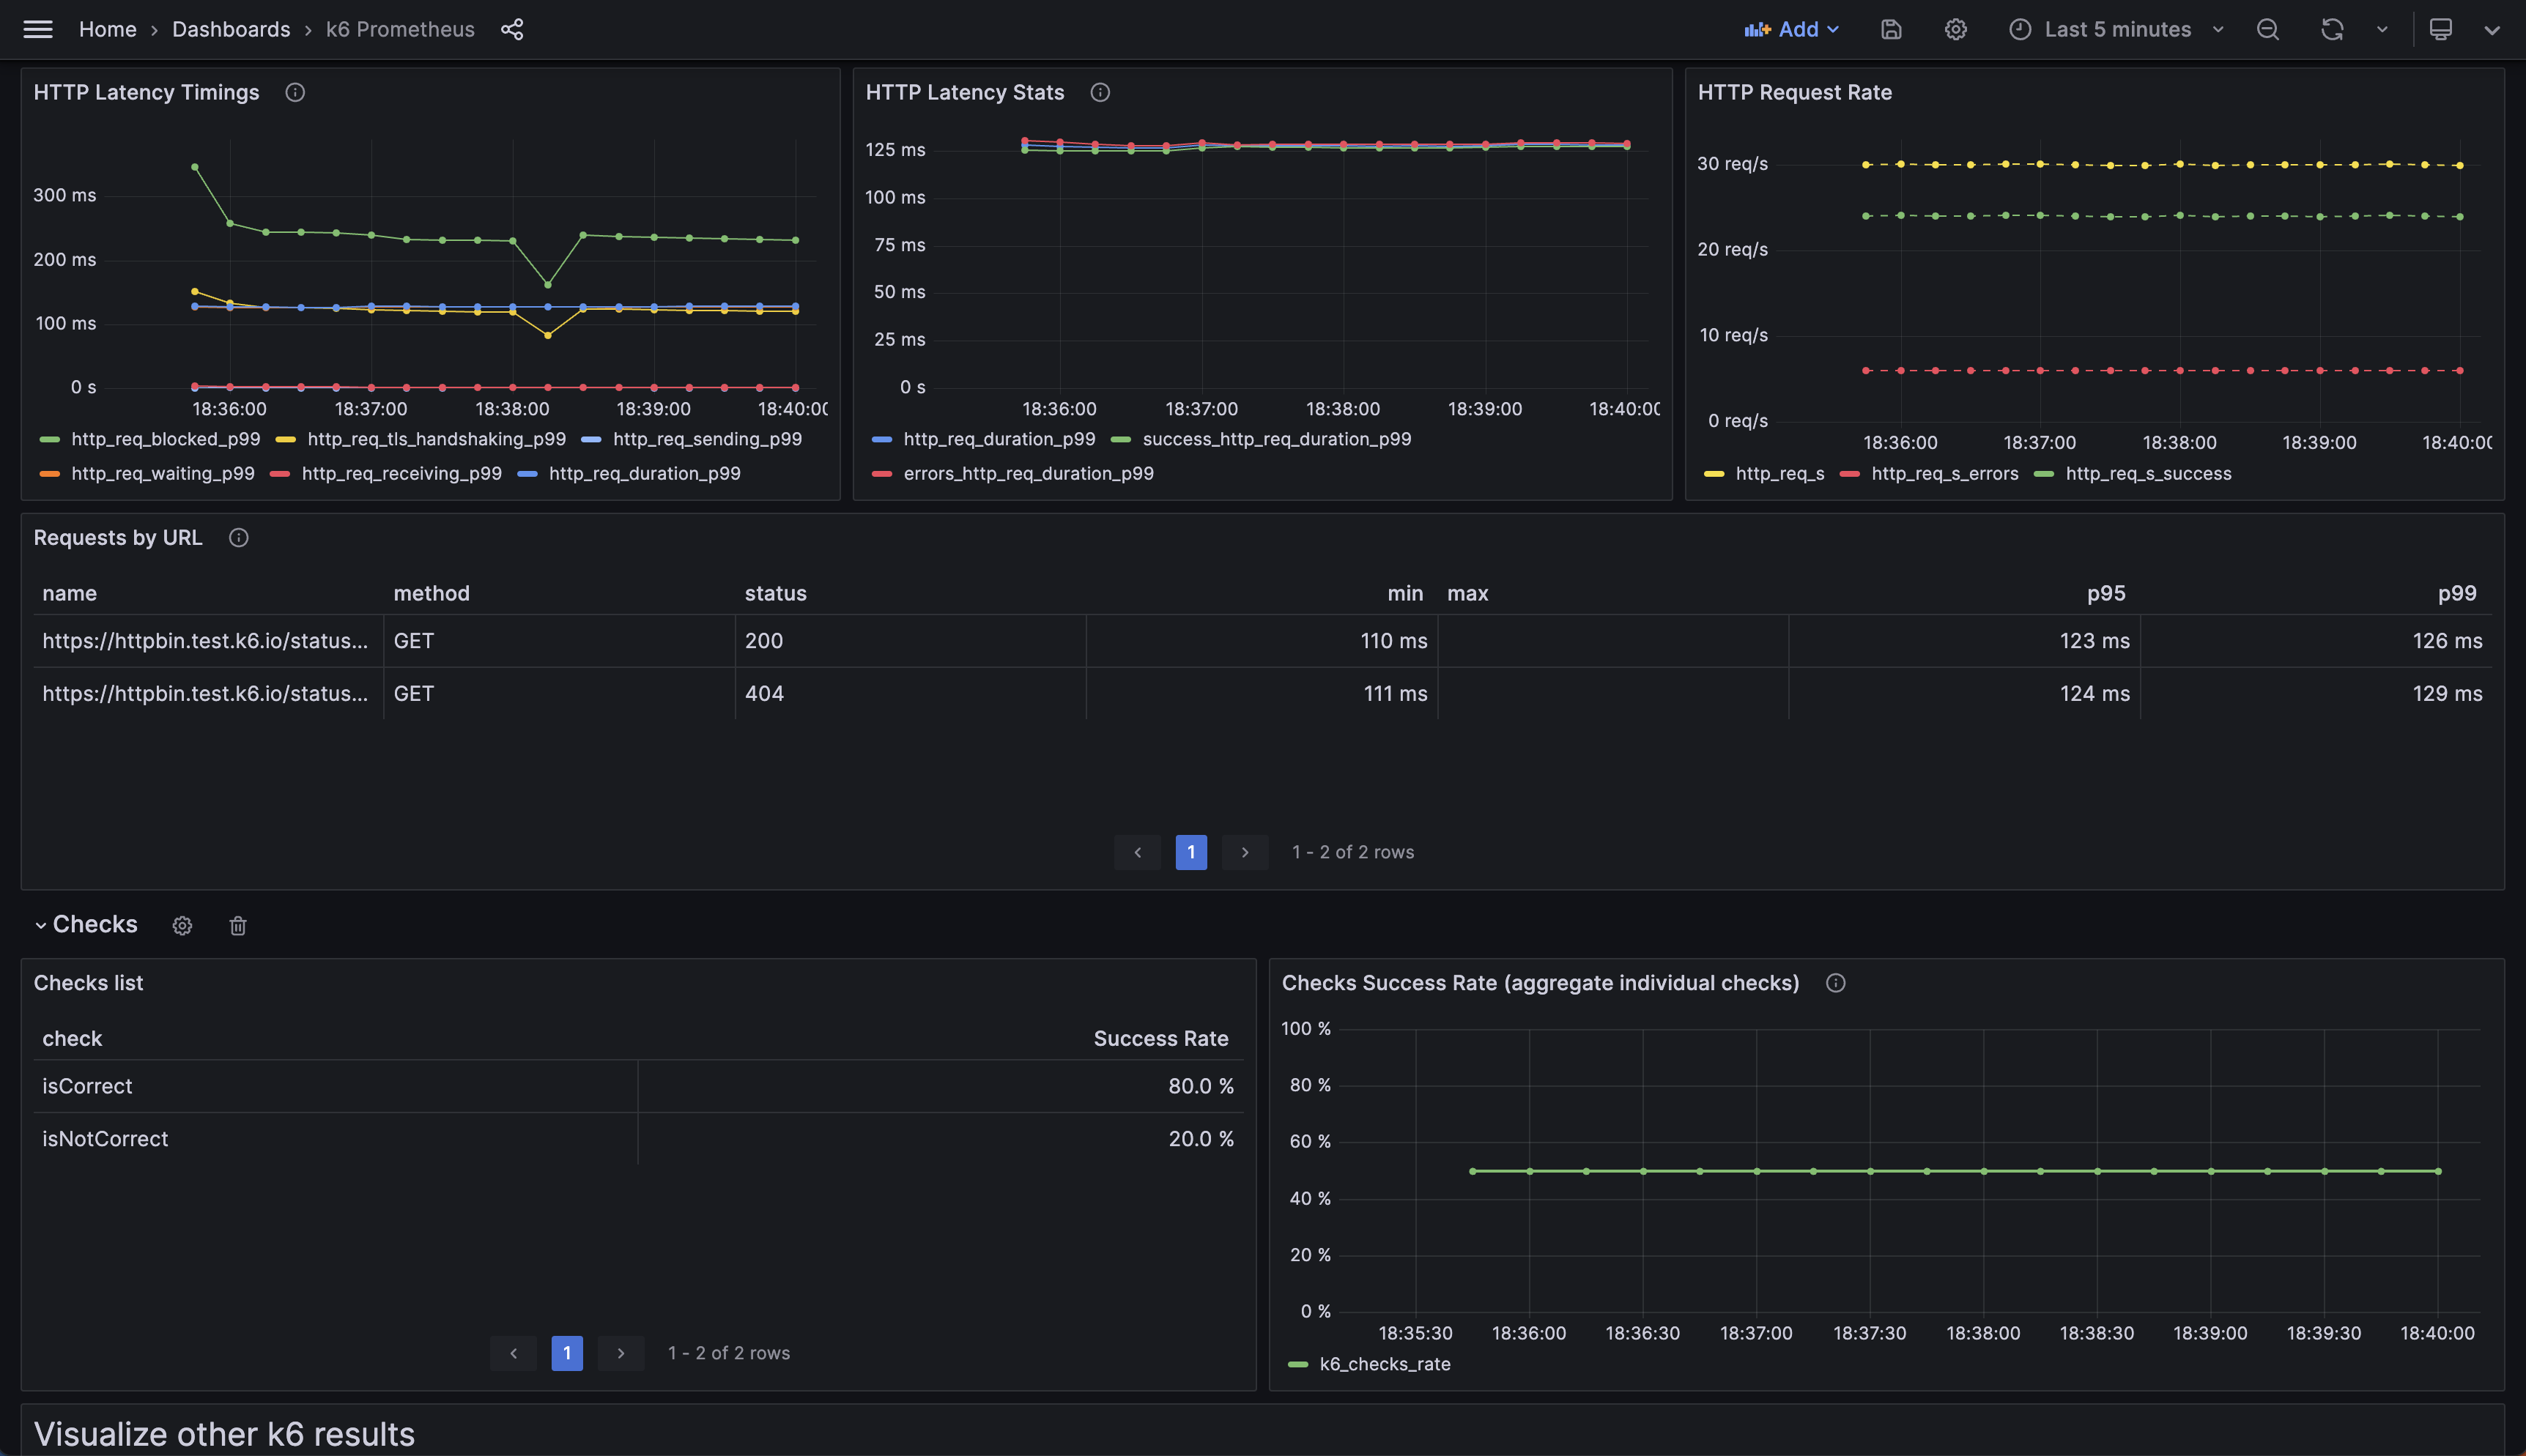
This dashboard visualizes live and historical performance of k6 load tests by querying Prometheus for metrics prefixed with k6_, covering request throughput, latency, and data transfer. It highlights key metrics like k6_http_reqs_total, k6_http_req_duration_, and k6_iteration_duration_ to track request rate, latency distributions, and duration per iteration, respectively, with panels for failures, peak RPS, and checks results. Users can add/modify visualizations via the top Add menu or Explore to tailor PromQL queries and panels, and the dashboard emphasizes granular timing statistics (quantiles via quantile_stat) alongside aggregate metrics such as data sent/received and blocked requests.
Screenshots
Used Metrics 1919
k6_checks_rate
k6_data_received_total
k6_data_sent_total
k6_dropped_iterations_total
k6_http_req_blocked_
k6_http_req_duration_
k6_http_req_duration_max
k6_http_req_duration_min
k6_http_req_duration_p95
k6_http_req_duration_p99
k6_http_req_failed_rate
k6_http_req_receiving_
k6_http_req_sending_
k6_http_req_tls_handshaking_
k6_http_req_waiting_
k6_http_reqs_total
k6_iteration_duration_
k6_vus
quantile_stat