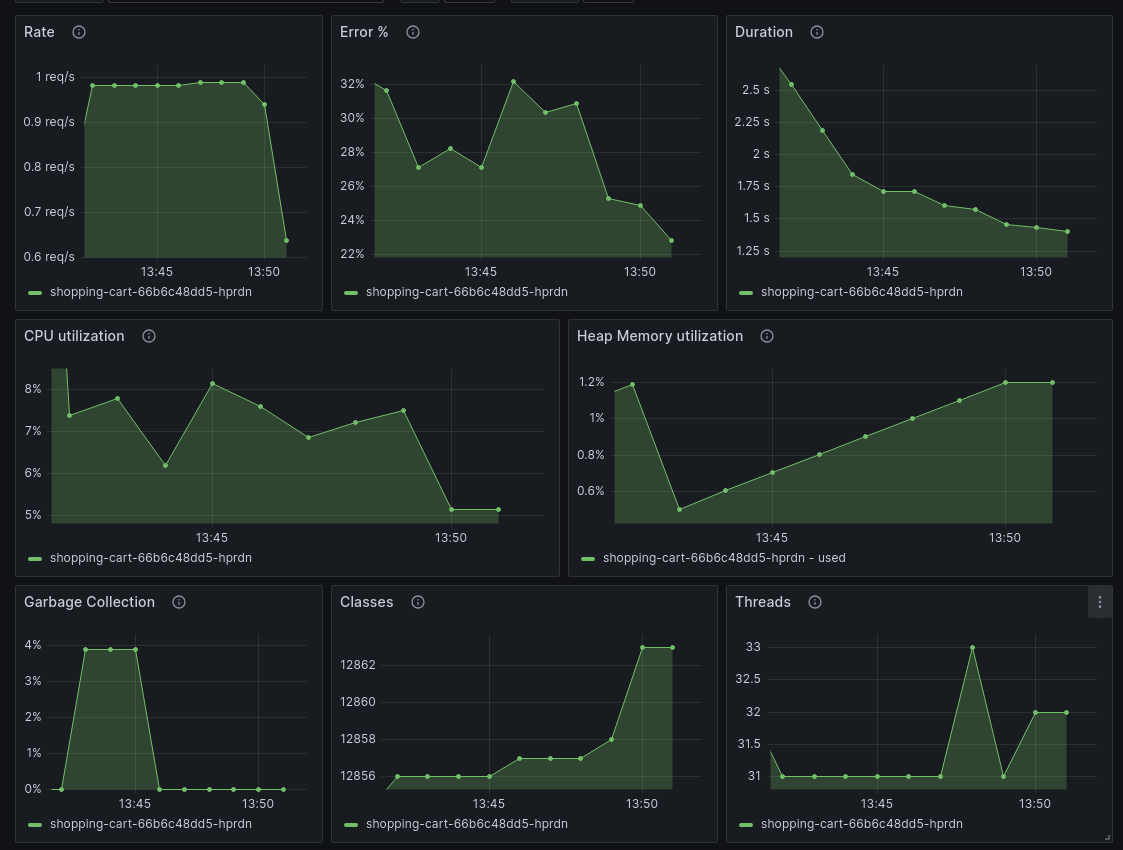
JVM Overview (OpenTelemetry)
2,512

Created 5/23/2023
Updated 12/1/2023
Revision 4
Grafana Version >=10.0.5
Datasources
Prometheus

Overview for the most important JVM metrics: CPU, memory, classes, threads, and garbage collection. If you're running an HTTP server, you also get RED metrics - request rate, error ratio, and request duration.

How to send data:

  • Grafana Cloud: Use "Connect Data" - search for "Java OpenTelemetry"
  • Grafana OSS stack: refer to the the documentation
Get Dashboard
Download
Copy to Clipboard
Source Grafana.com

Used Metrics 1

  • jvm_gc_pause_milliseconds_sum