JVM Overview (Micrometer OTLP) 786786
6/6/2023
7/7/2023
6
>=10.1.0-57731pre
Prometheus
Description
Dashboard for JVM metrics with Spring Boot OTLP metric exporter
Screenshots
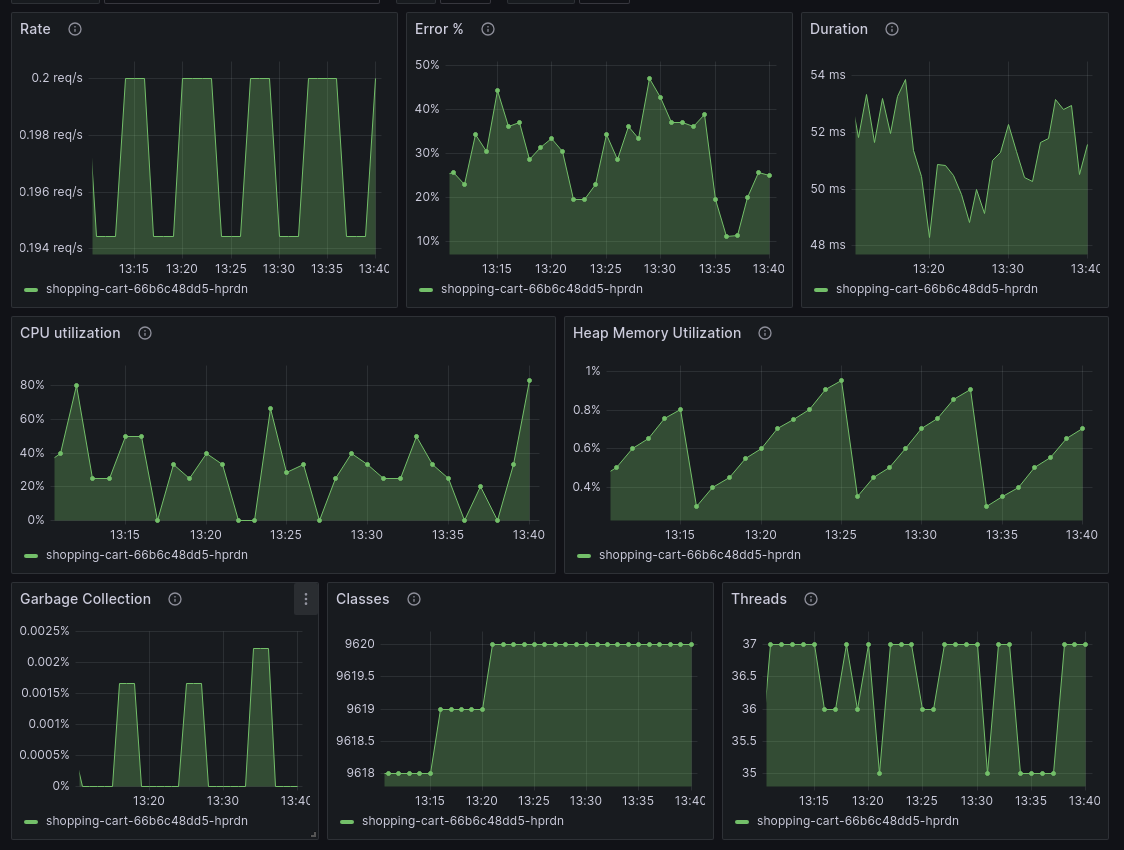
Used Metrics 88
http_server_requests_bucket
http_server_requests_count
jvm_classes_loaded
jvm_gc_pause_sum
jvm_memory_max
jvm_memory_used
jvm_threads_live
system_cpu_usage
Get Dashboard✕
Download
Copy to Clipboard