JVM (Micrometer) 25,588,27825,588,278 4.4 (19 reviews)
2/13/2018
11/22/2024
10
>=4.6.5
Prometheus
Description
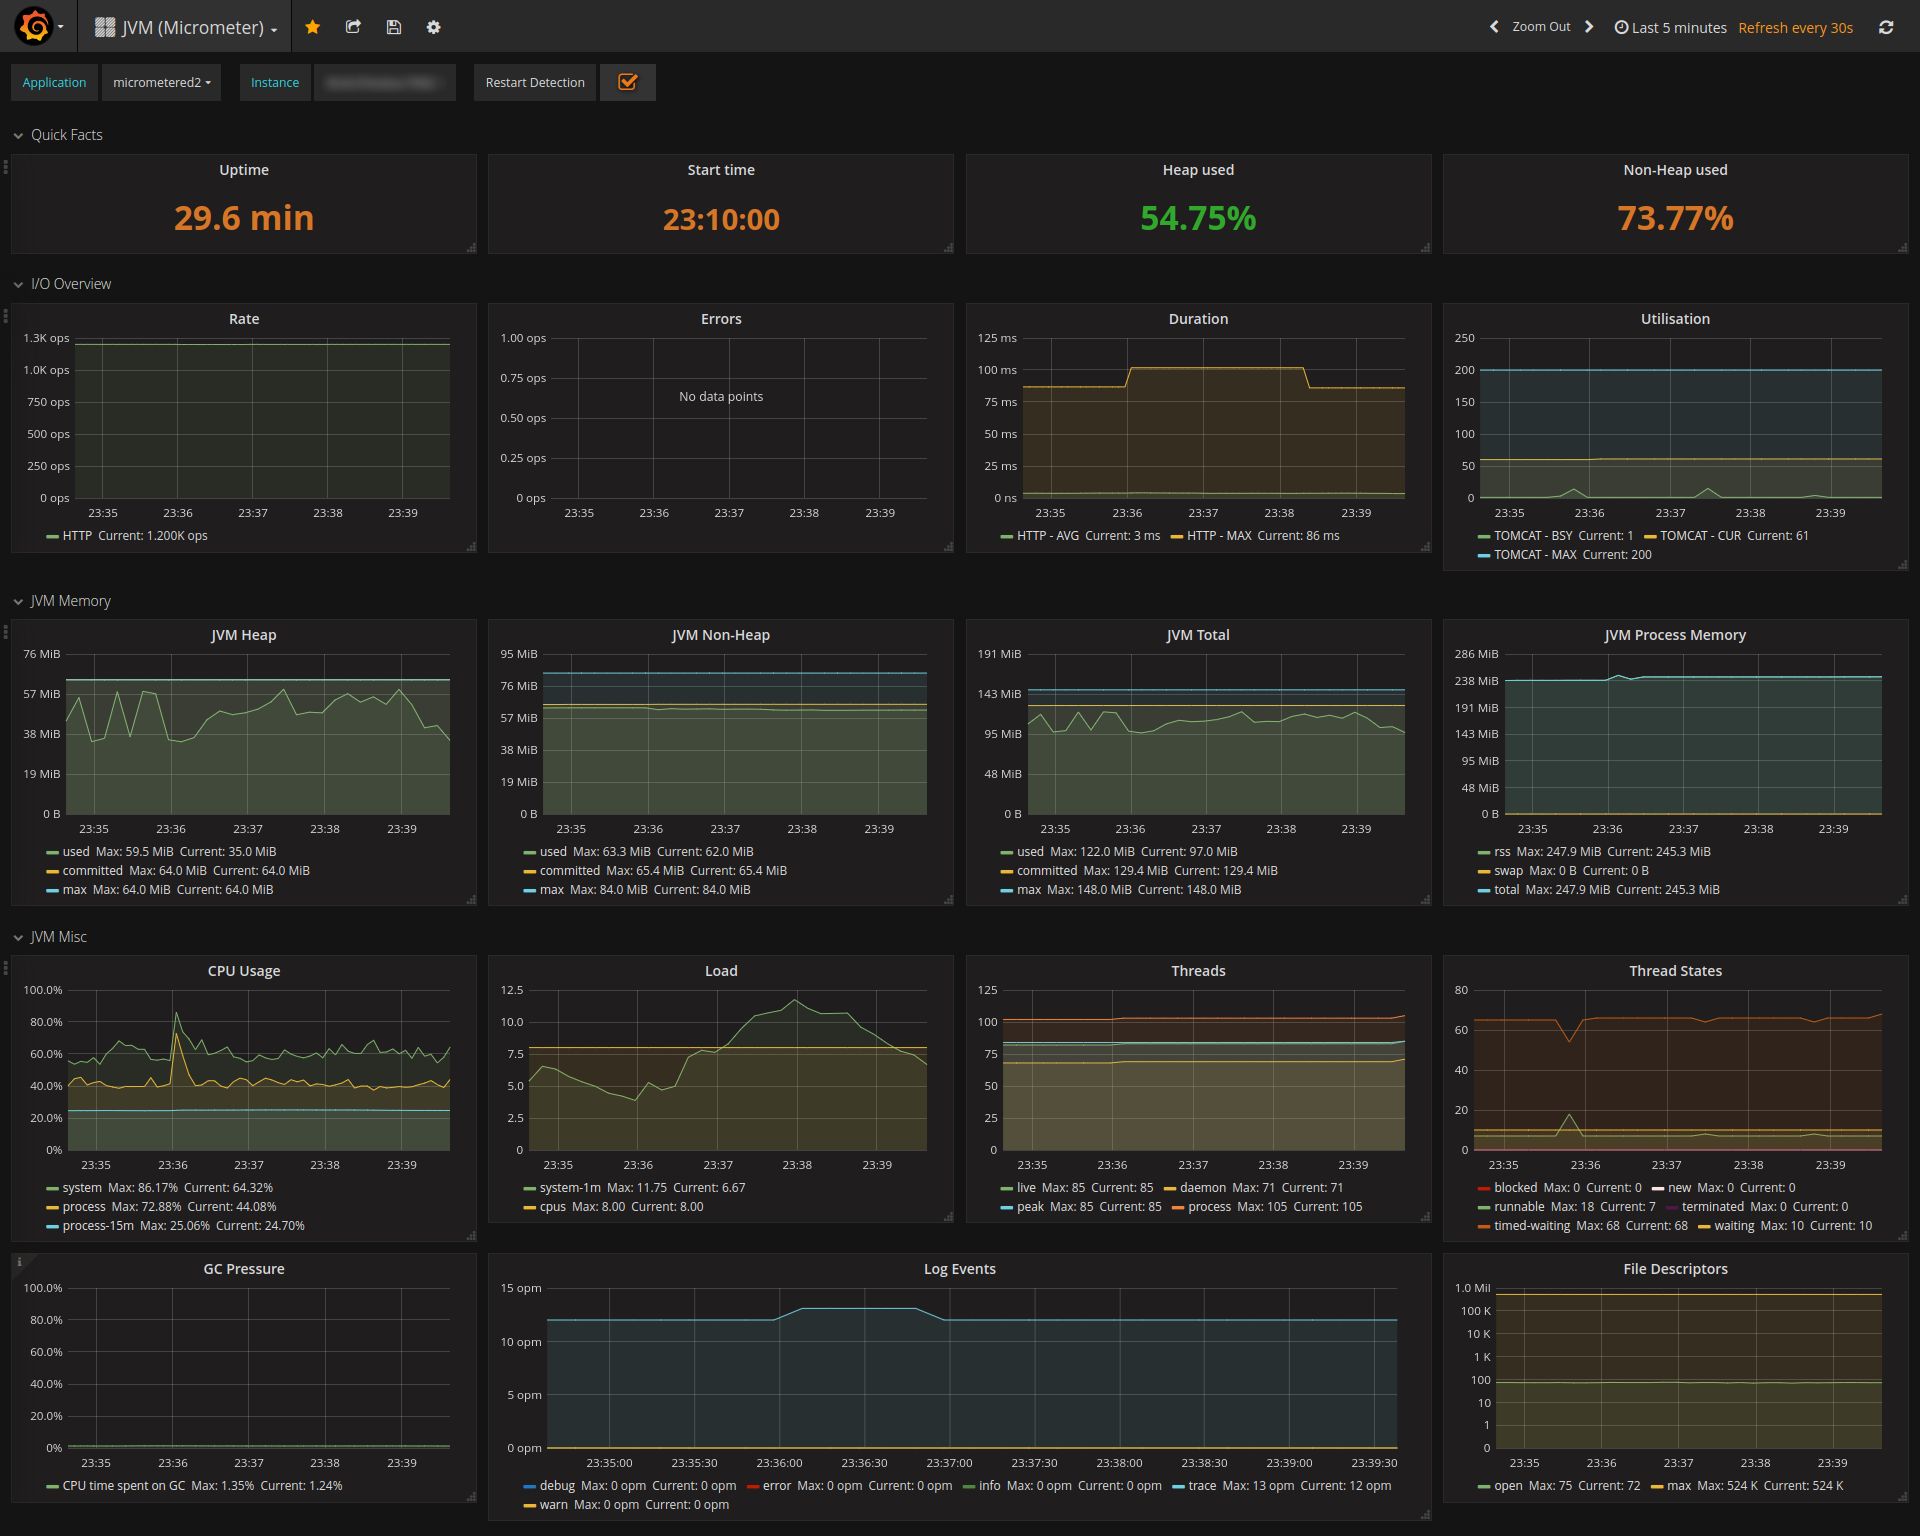
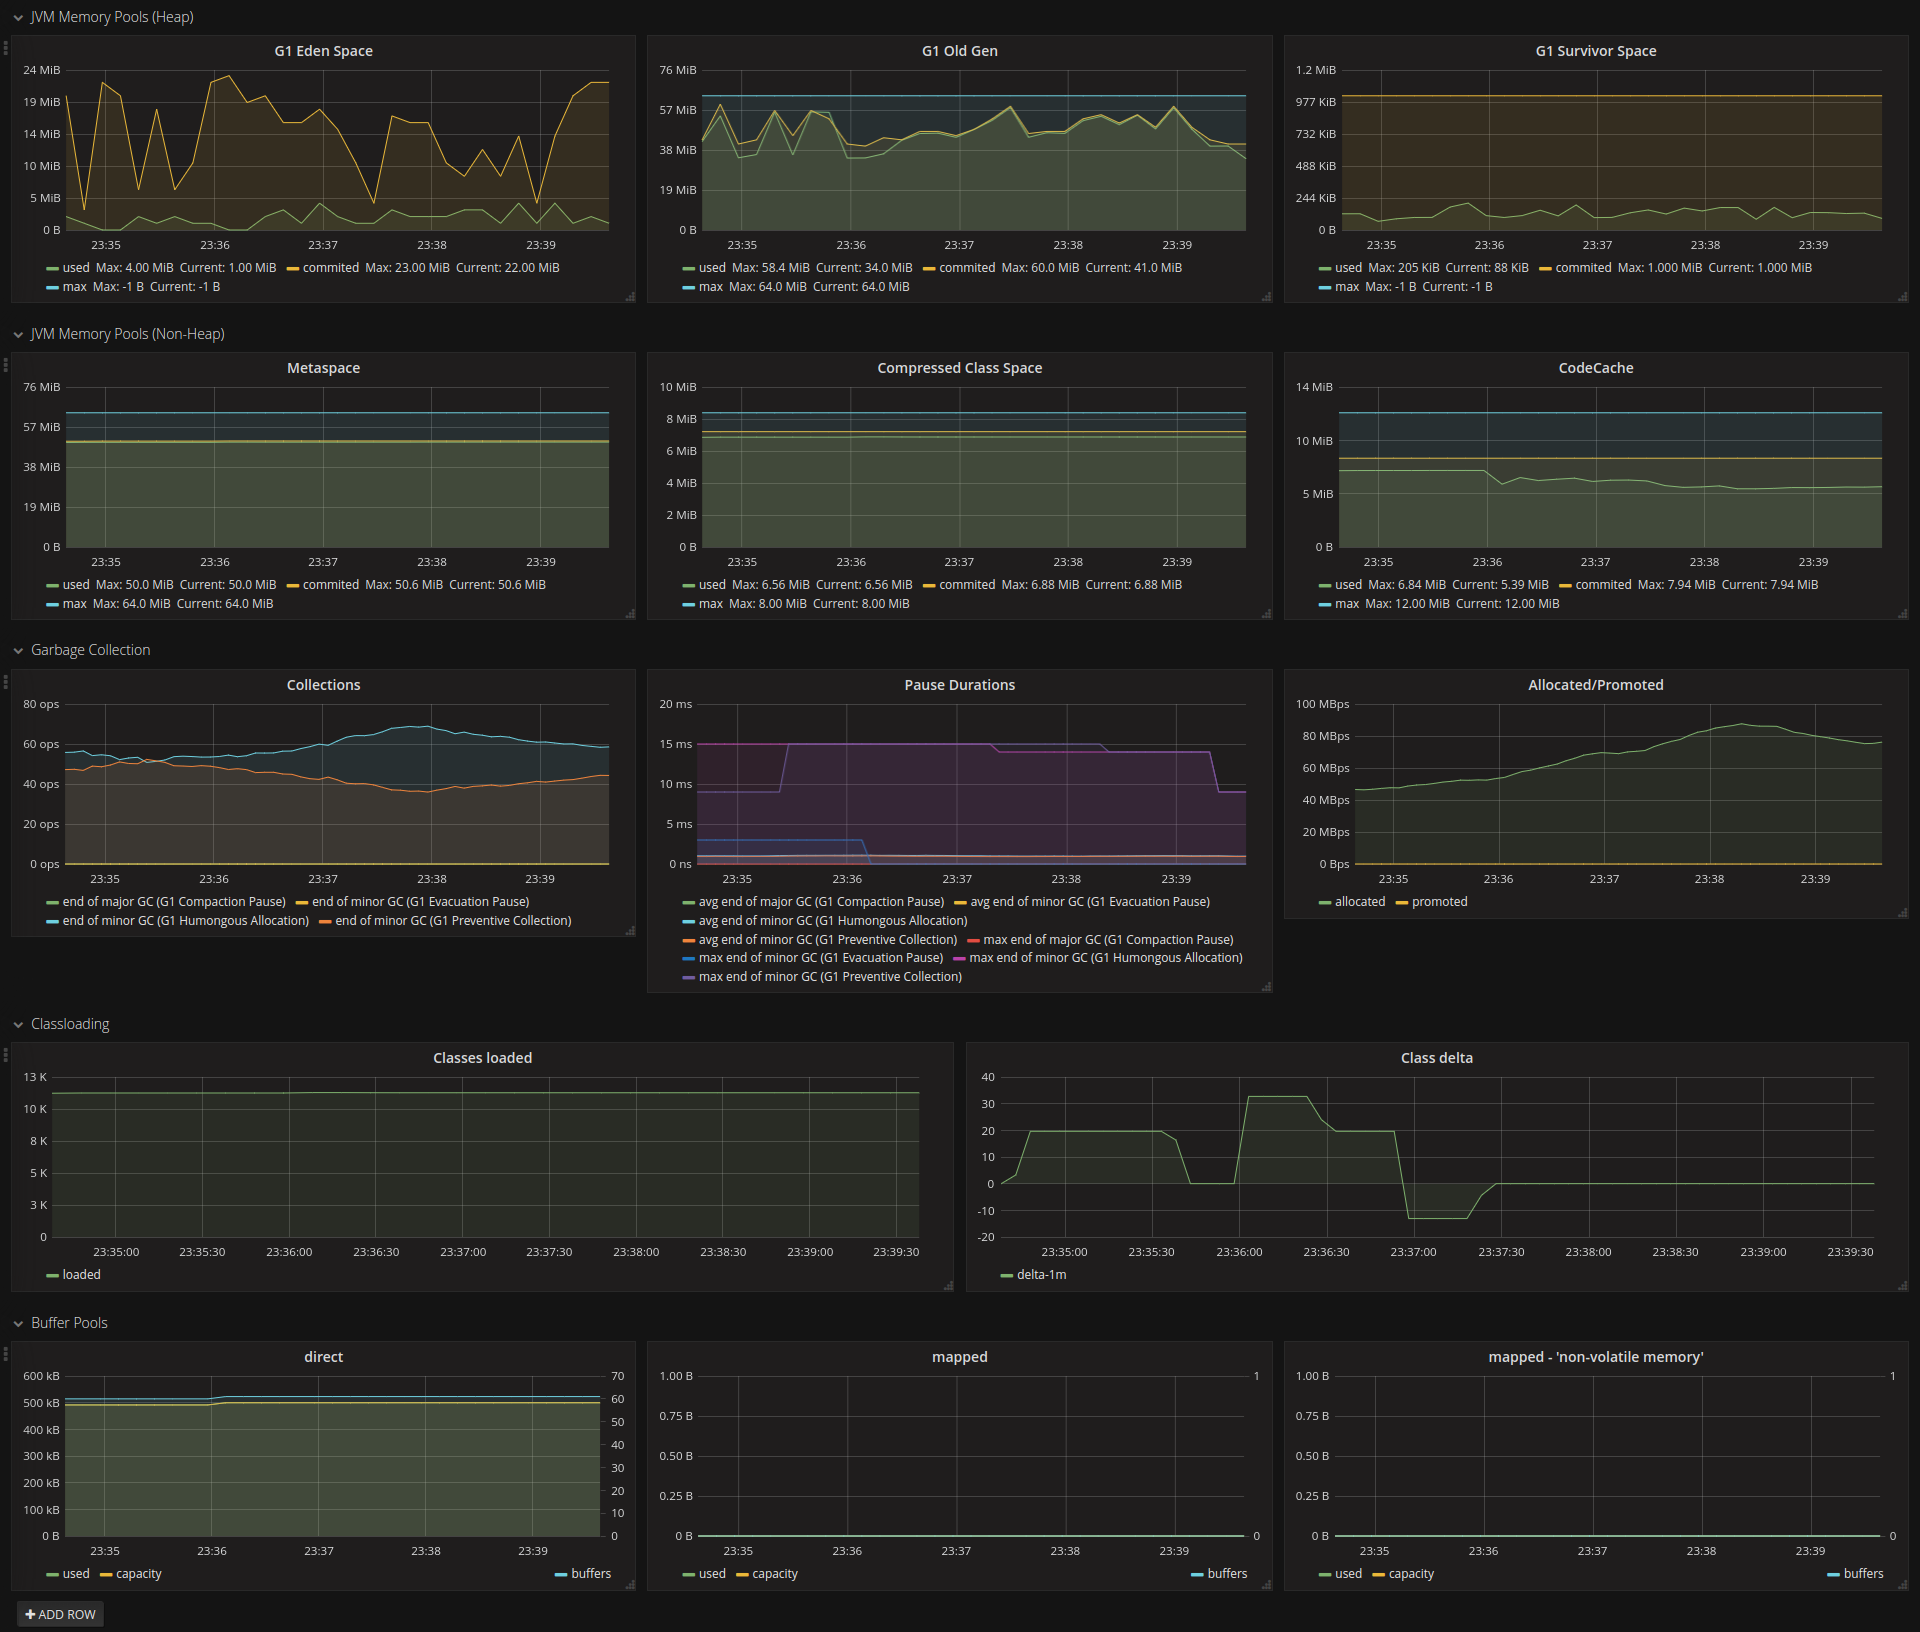
This Grafana dashboard monitors JVM runtime and micrometer-reported metrics to give a holistic view of application health and performance. It focuses on memory, garbage collection, thread activity, and request-level timing, with panels that highlight JVM saturation, GC pauses, live thread counts, and latency distributions to help identify bottlenecks and stability concerns across the application stack.
Screenshots
Get Dashboard✕
Download
Copy to Clipboard