JVM Metrics 2,1452,145
1/4/2019
5/7/2020
4
>=5.4.2
Prometheus
Description
Screenshots

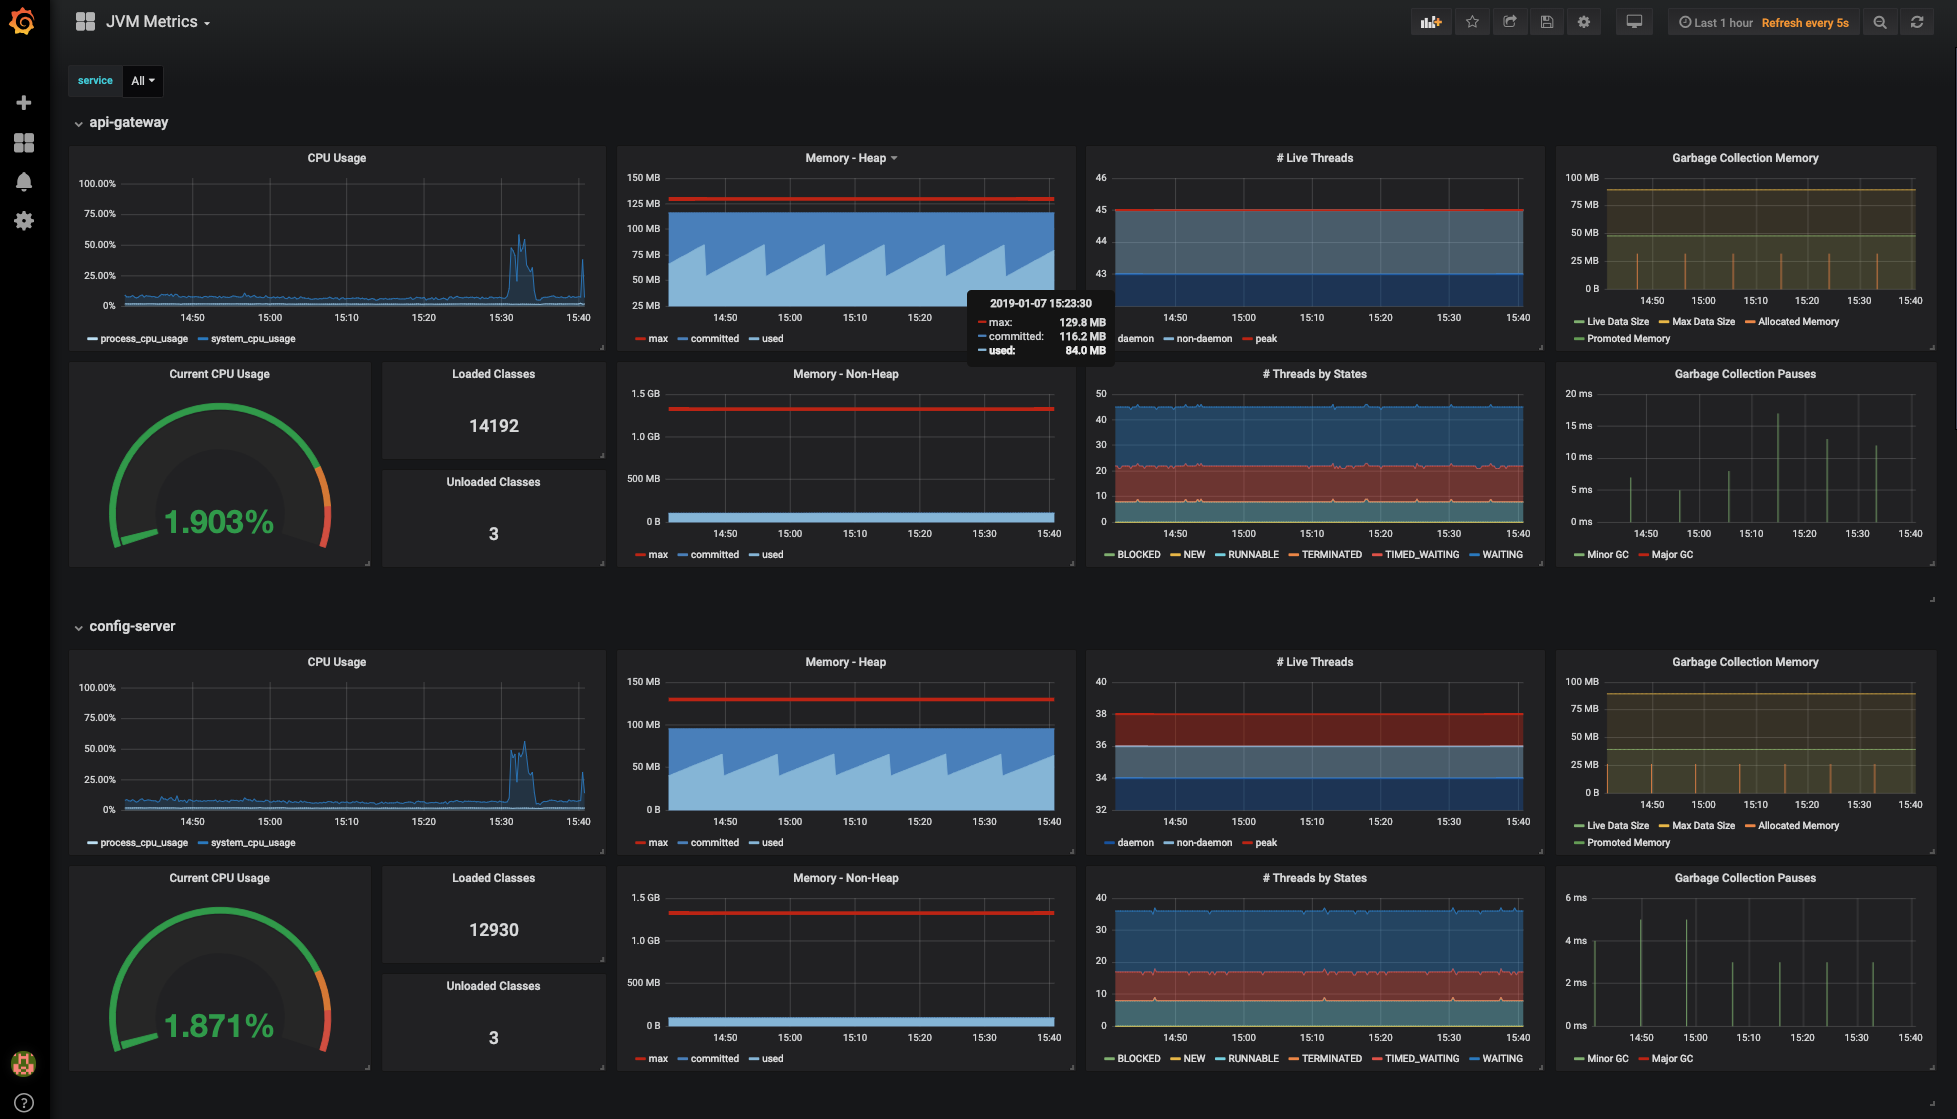
Used Metrics 1616
jvm_classes_loaded
jvm_classes_unloaded
jvm_gc_live_data_size
jvm_gc_max_data_size
jvm_gc_memory_allocated
jvm_gc_memory_promoted
jvm_gc_pause
jvm_memory_committed
jvm_memory_max
jvm_memory_used
jvm_threads_daemon
jvm_threads_live
jvm_threads_peak
jvm_threads_states
process_cpu_usage
system_cpu_usage
Get Dashboard✕
Download
Copy to Clipboard