JMX Overview (OpenTelemetry) 1,0651,065
12/12/2022
2/17/2024
2
>=9.3.6
Prometheus
Description
Dashboard for JVM metrics with Prometheus / OpenTelemetry instrumentation
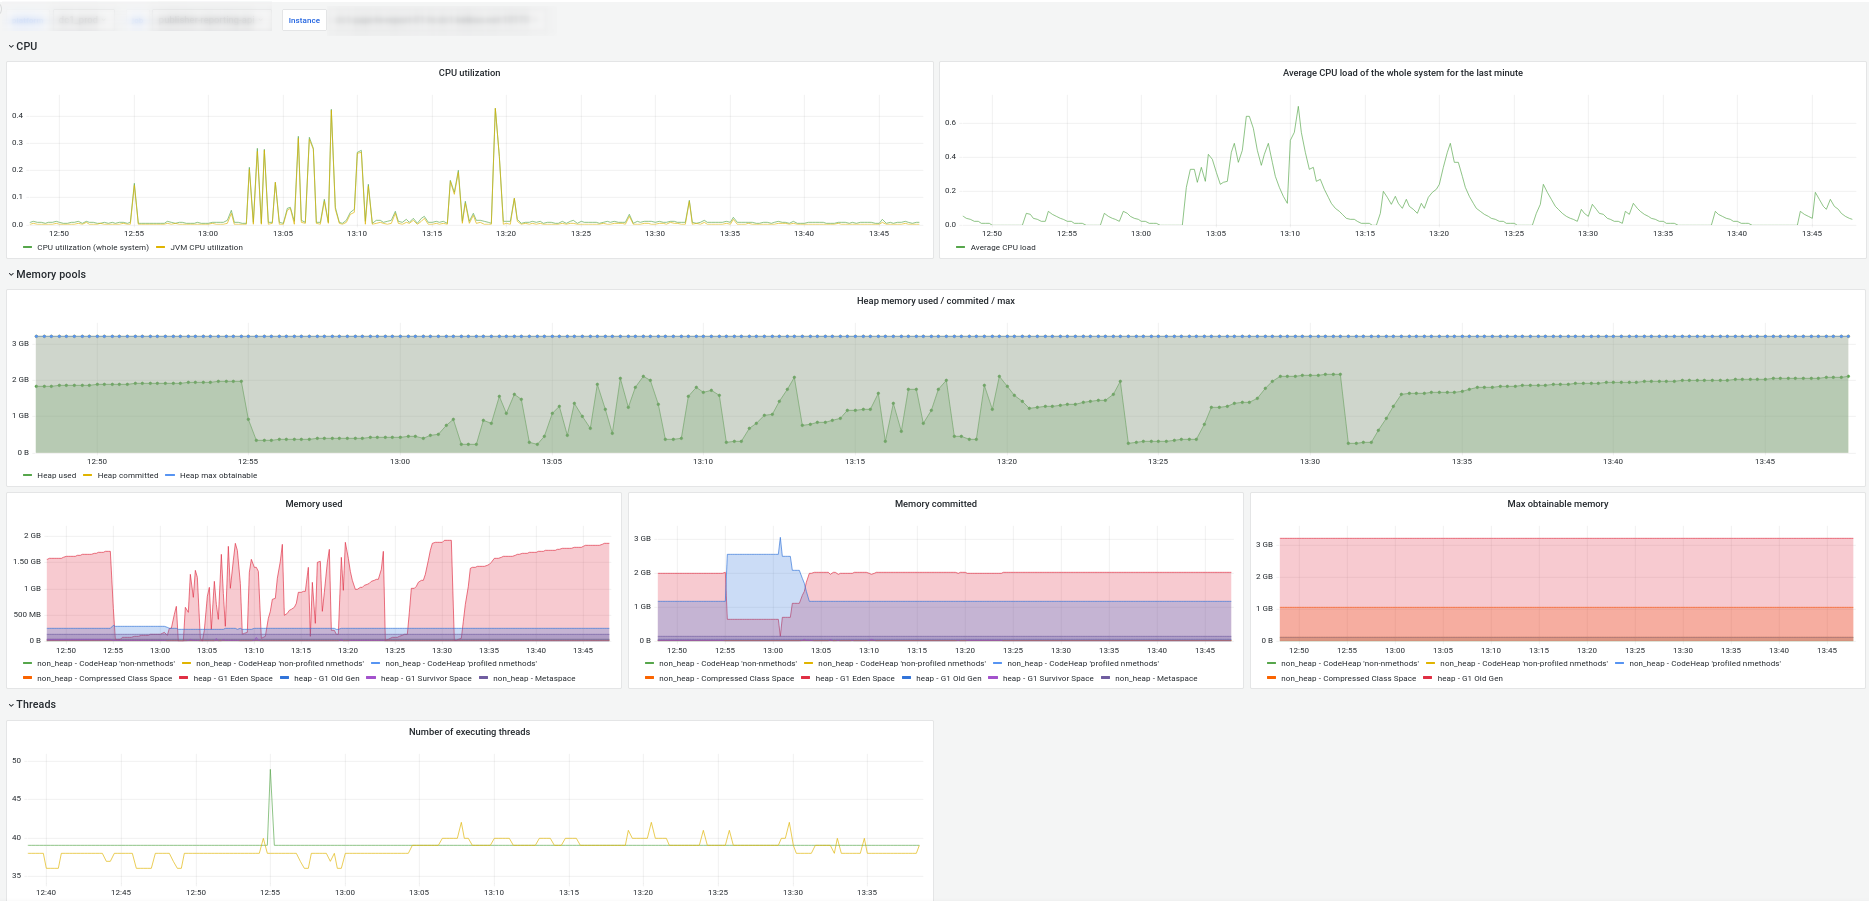
Screenshots

Used Metrics 1111
__interval_ms
jvm_class_count
jvm_class_loaded_total
jvm_class_unloaded_total
jvm_cpu_recent_utilization_ratio
jvm_gc_duration_seconds_bucket
jvm_memory_committed_bytes
jvm_memory_limit_bytes
jvm_memory_used_bytes
jvm_system_cpu_load_
jvm_thread_count
Get Dashboard✕
Download
Copy to Clipboard