JMX Dashboard(Basic) 130,165130,165 5.0 (3 reviews)
Description
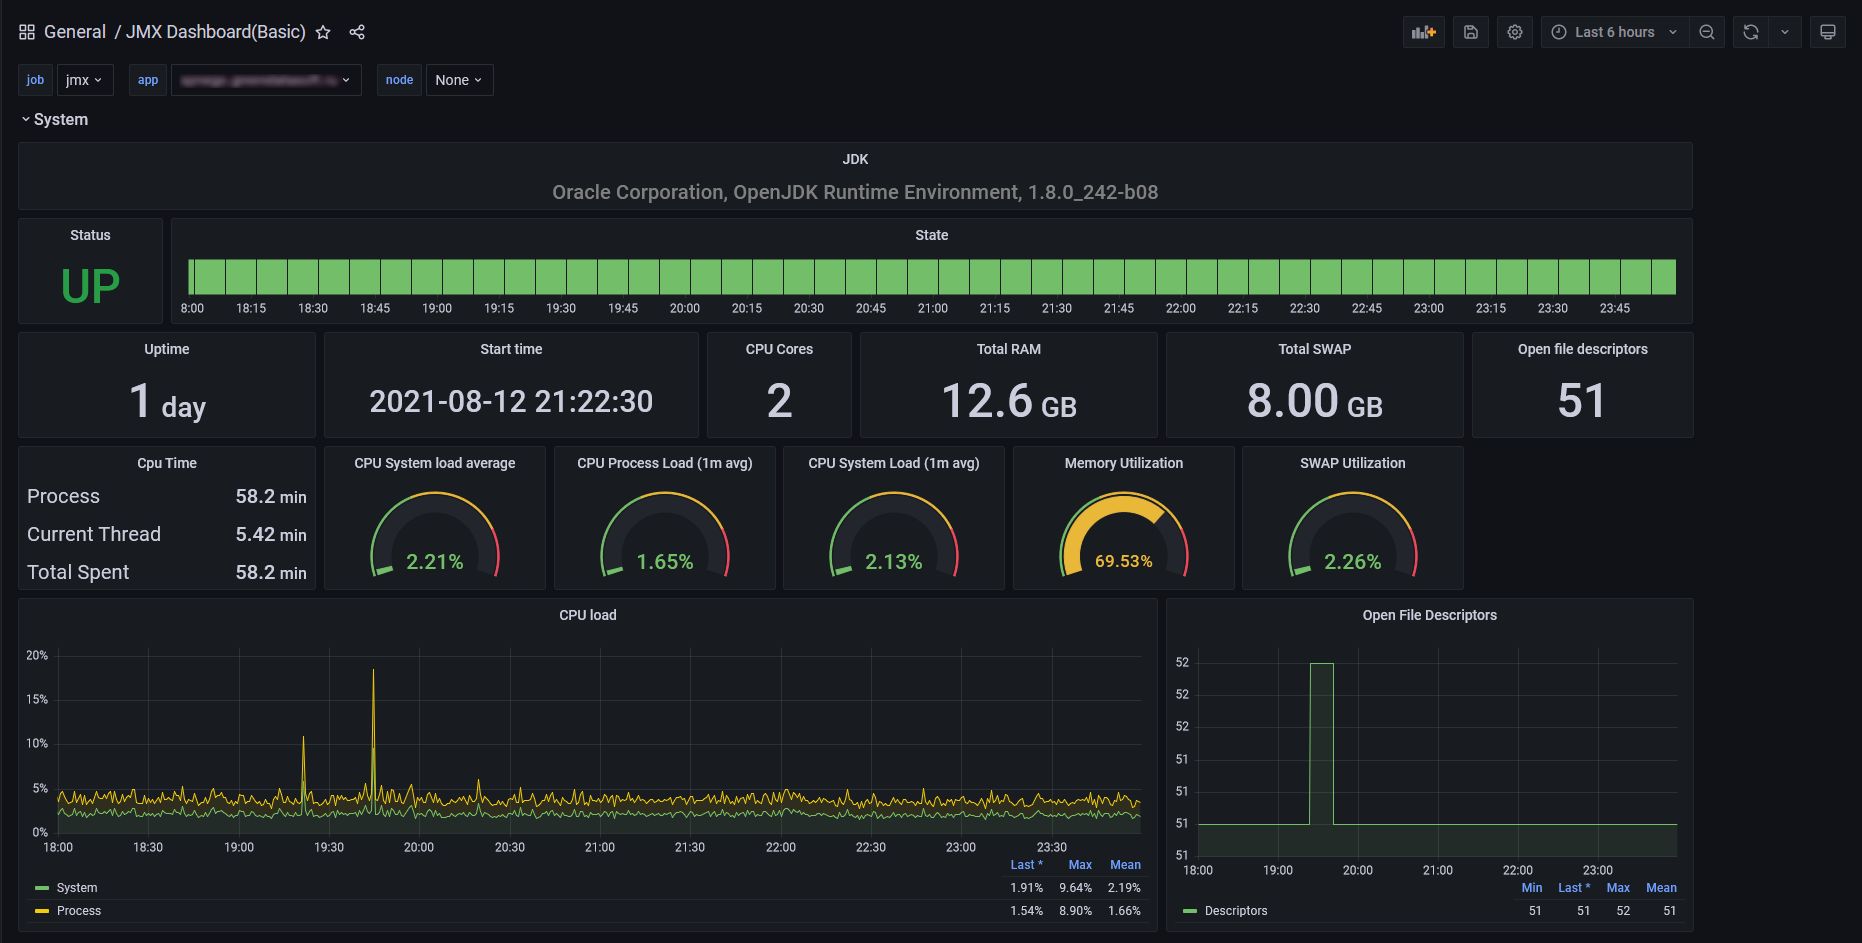
This dashboard monitors a Java application's runtime health and resource utilization, combining JMX-derived metrics with system-level indicators. It highlights core metrics such as jvm_info with JVM version and vendor details, java_lang_Runtime_Uptime and java_lang_Runtime_StartTime for lifecycle insights, and java_lang_OperatingSystem_AvailableProcessors along with memory metrics to track CPU cores and overall memory usage. Key features include real-time CPU, memory, and swap utilization panels, startup and uptime tracking, and open file descriptors to surface potential resource constraints.
Screenshots
Used Metrics 4545
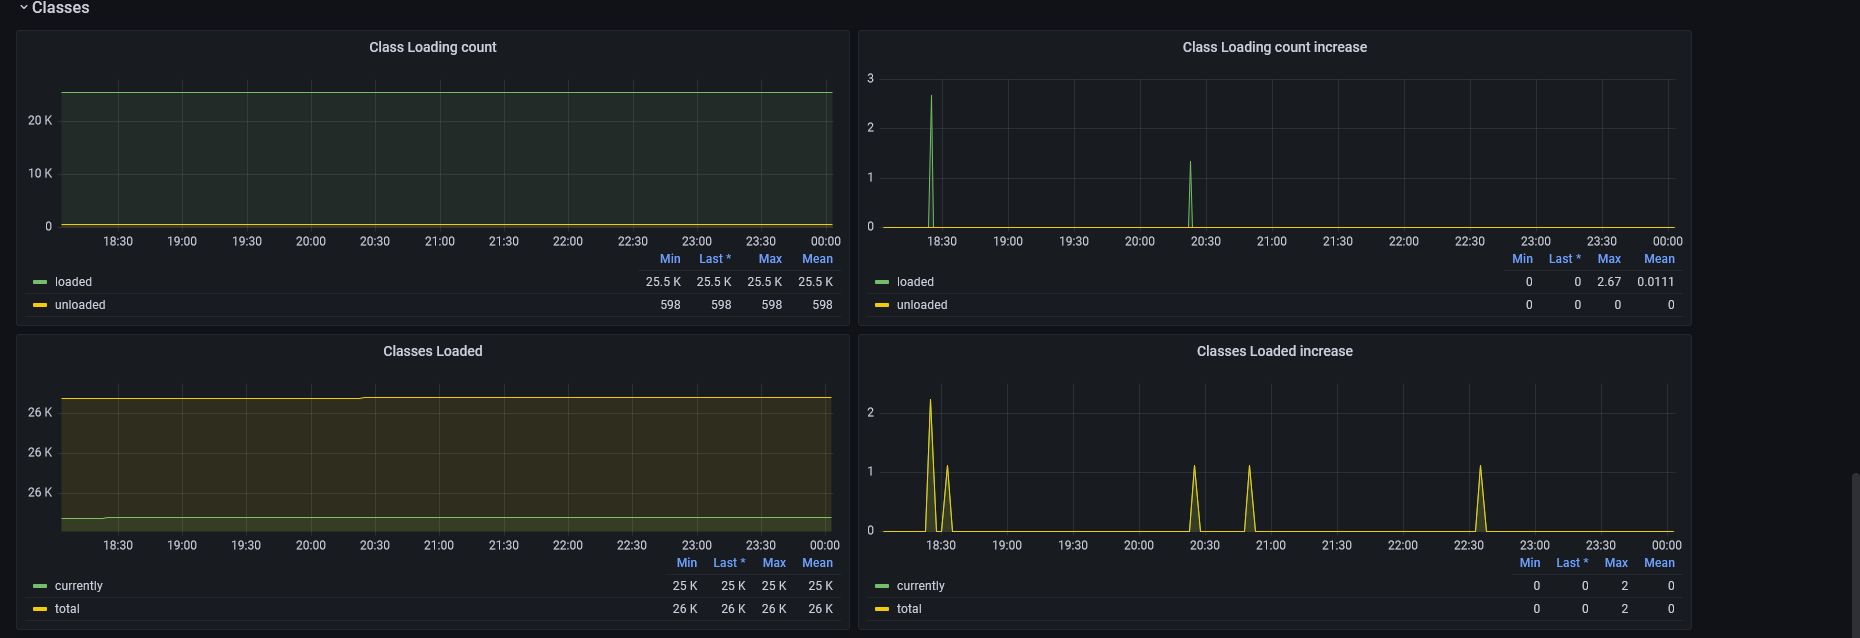
java_lang_ClassLoading_LoadedClassCount
java_lang_ClassLoading_UnloadedClassCount
java_lang_OperatingSystem_AvailableProcessors
java_lang_OperatingSystem_CommittedVirtualMemorySize
java_lang_OperatingSystem_FreePhysicalMemorySize
java_lang_OperatingSystem_FreeSwapSpaceSize
java_lang_OperatingSystem_OpenFileDescriptorCount
java_lang_OperatingSystem_ProcessCpuLoad
java_lang_OperatingSystem_ProcessCpuTime
java_lang_OperatingSystem_SystemCpuLoad
java_lang_OperatingSystem_TotalPhysicalMemorySize
java_lang_OperatingSystem_TotalSwapSpaceSize
java_lang_Runtime_StartTime
java_lang_Runtime_Uptime
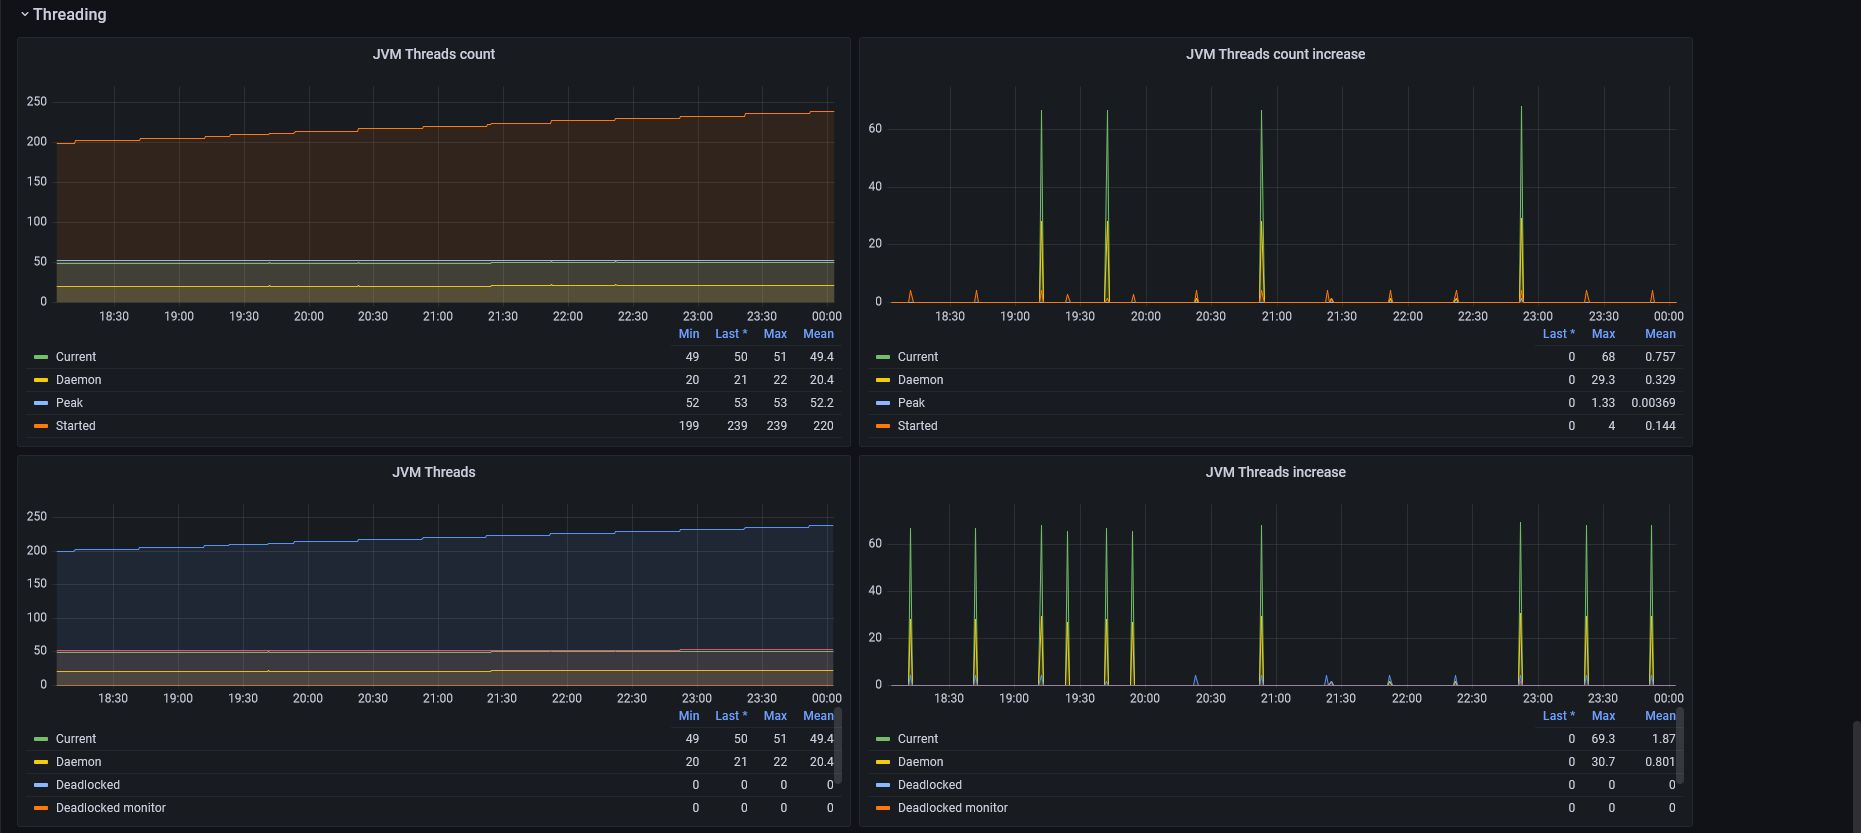
java_lang_Threading_CurrentThreadCpuTime
java_lang_Threading_DaemonThreadCount
java_lang_Threading_PeakThreadCount
java_lang_Threading_ThreadCount
java_lang_Threading_TotalStartedThreadCount
jdk
jvm_classes_currently_loaded
jvm_classes_loaded_total
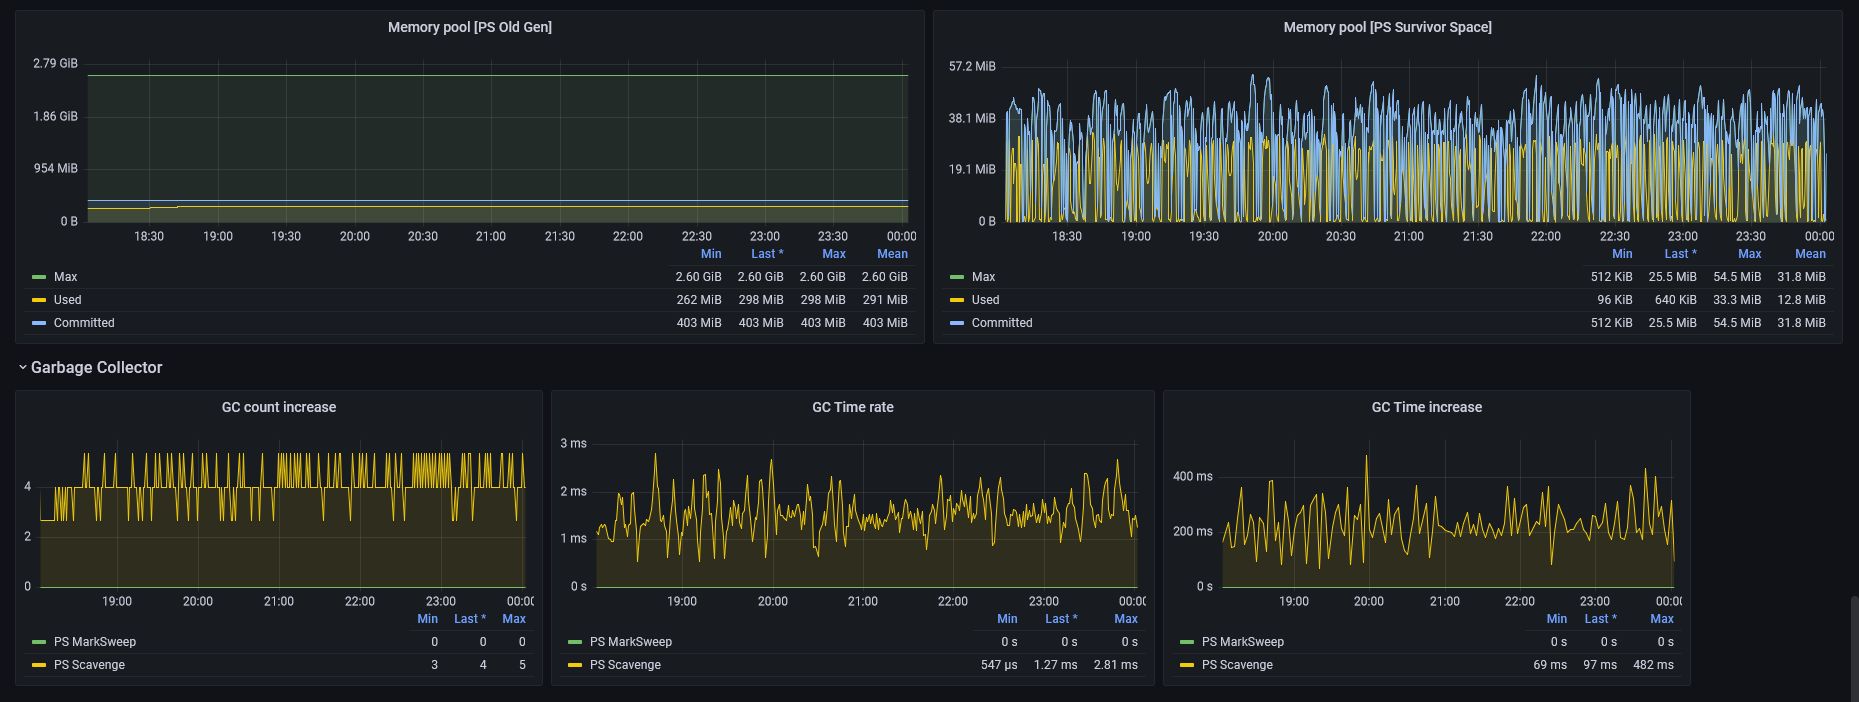
jvm_gc_collection_seconds_count
jvm_gc_collection_seconds_sum
jvm_info
jvm_memory_bytes_committed
jvm_memory_bytes_max
jvm_memory_bytes_used
jvm_memory_pool_bytes_committed
jvm_memory_pool_bytes_max
jvm_memory_pool_bytes_used
jvm_threads_current
jvm_threads_daemon
jvm_threads_deadlocked
jvm_threads_deadlocked_monitor
jvm_threads_peak
jvm_threads_started_total
-
process_cpu_seconds_total
-
process_open_fds
-
process_resident_memory_bytes
-
process_virtual_memory_bytes
runtime
-
up
vendor
version