Jenkins: Performance and Health Overview 97,63697,636 5.0 (1 reviews)
Description
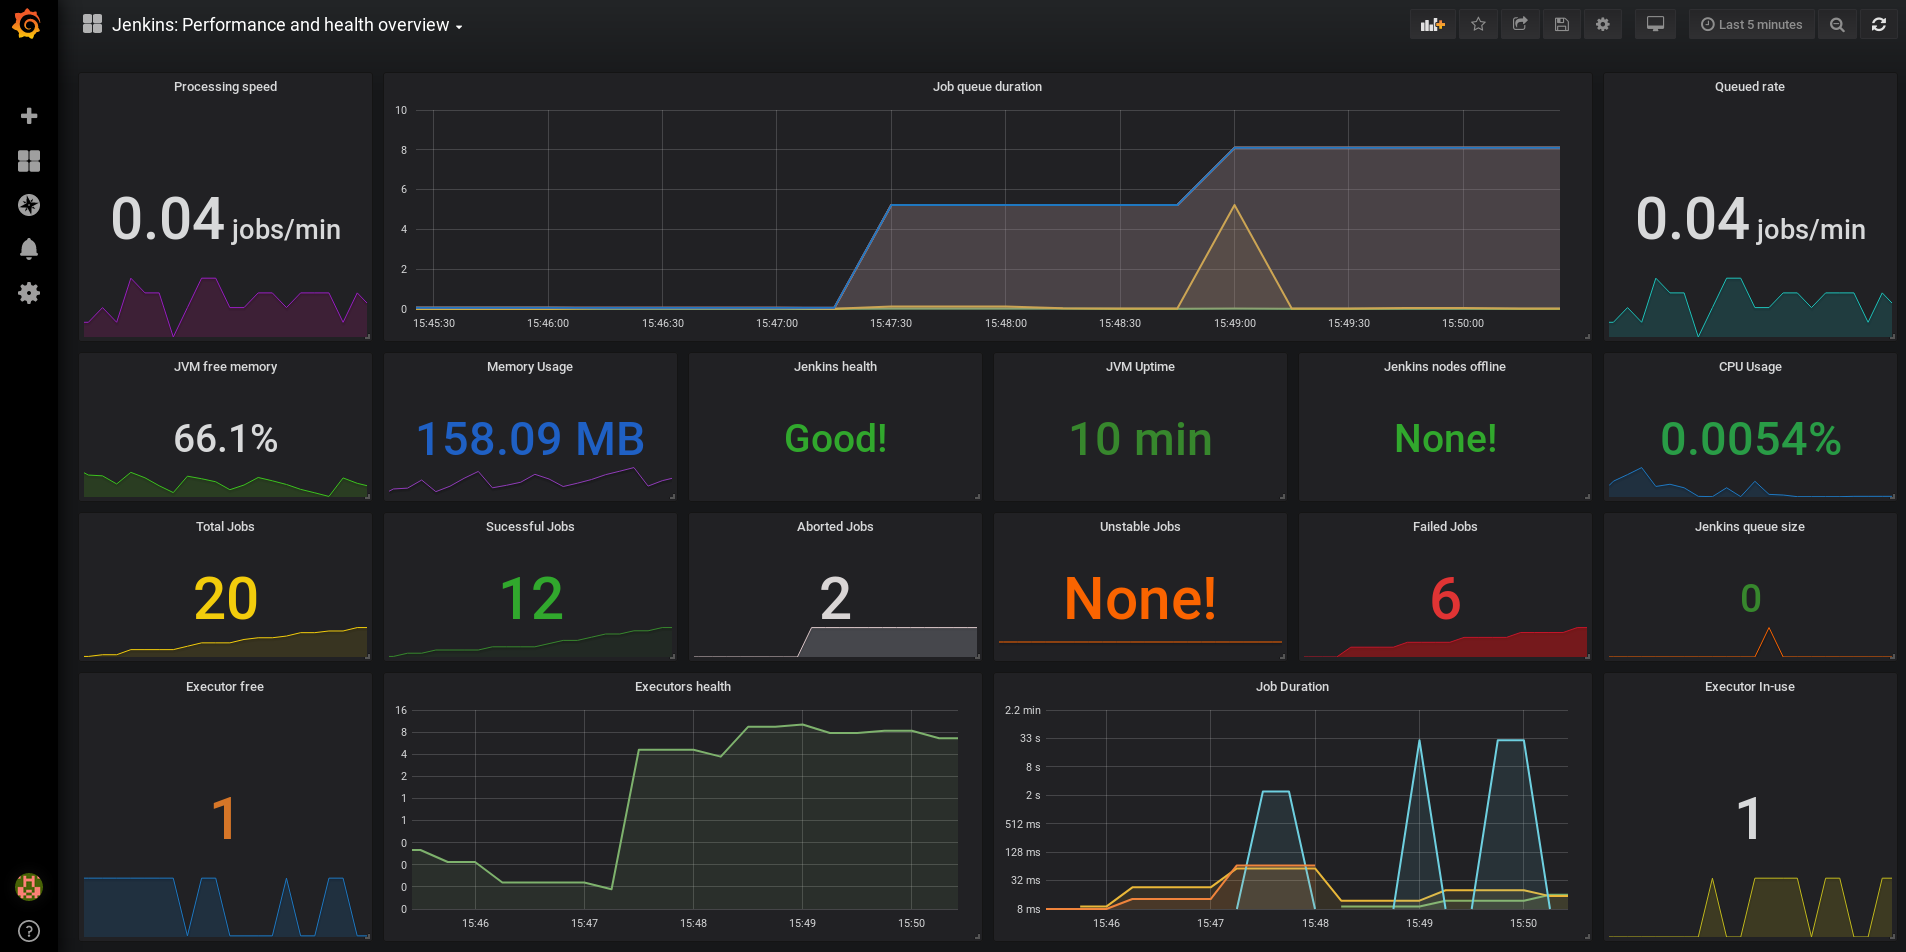
This dashboard provides a real-time overview of Jenkins performance and health by aggregating build, queue, and resource metrics. It highlights key indicators such as jenkins_job_building_duration_count, jenkins_job_queuing_duration, and vm_memory_total_used to surface throughput, wait times, and memory pressure, while panels like JVM Uptime and Jenkins health check score give quick health assessments and trend visibility across nodes and executors.
Screenshots
Used Metrics 1919
default_jenkins_builds_last_build_duration_milliseconds
jenkins_executor_free_value
jenkins_executor_in_use_value
jenkins_health_check_score
jenkins_job_building_duration
jenkins_job_building_duration_count
jenkins_job_queuing_duration
jenkins_job_queuing_duration_count
jenkins_node_builds_count
jenkins_node_offline_value
jenkins_queue_size_value
jenkins_runs_aborted_total
jenkins_runs_failure_total
jenkins_runs_success_total
jenkins_runs_unstable_total
vm_cpu_load
vm_memory_total_max
vm_memory_total_used
vm_uptime_milliseconds