Jenkins overview 1,7391,739
Description
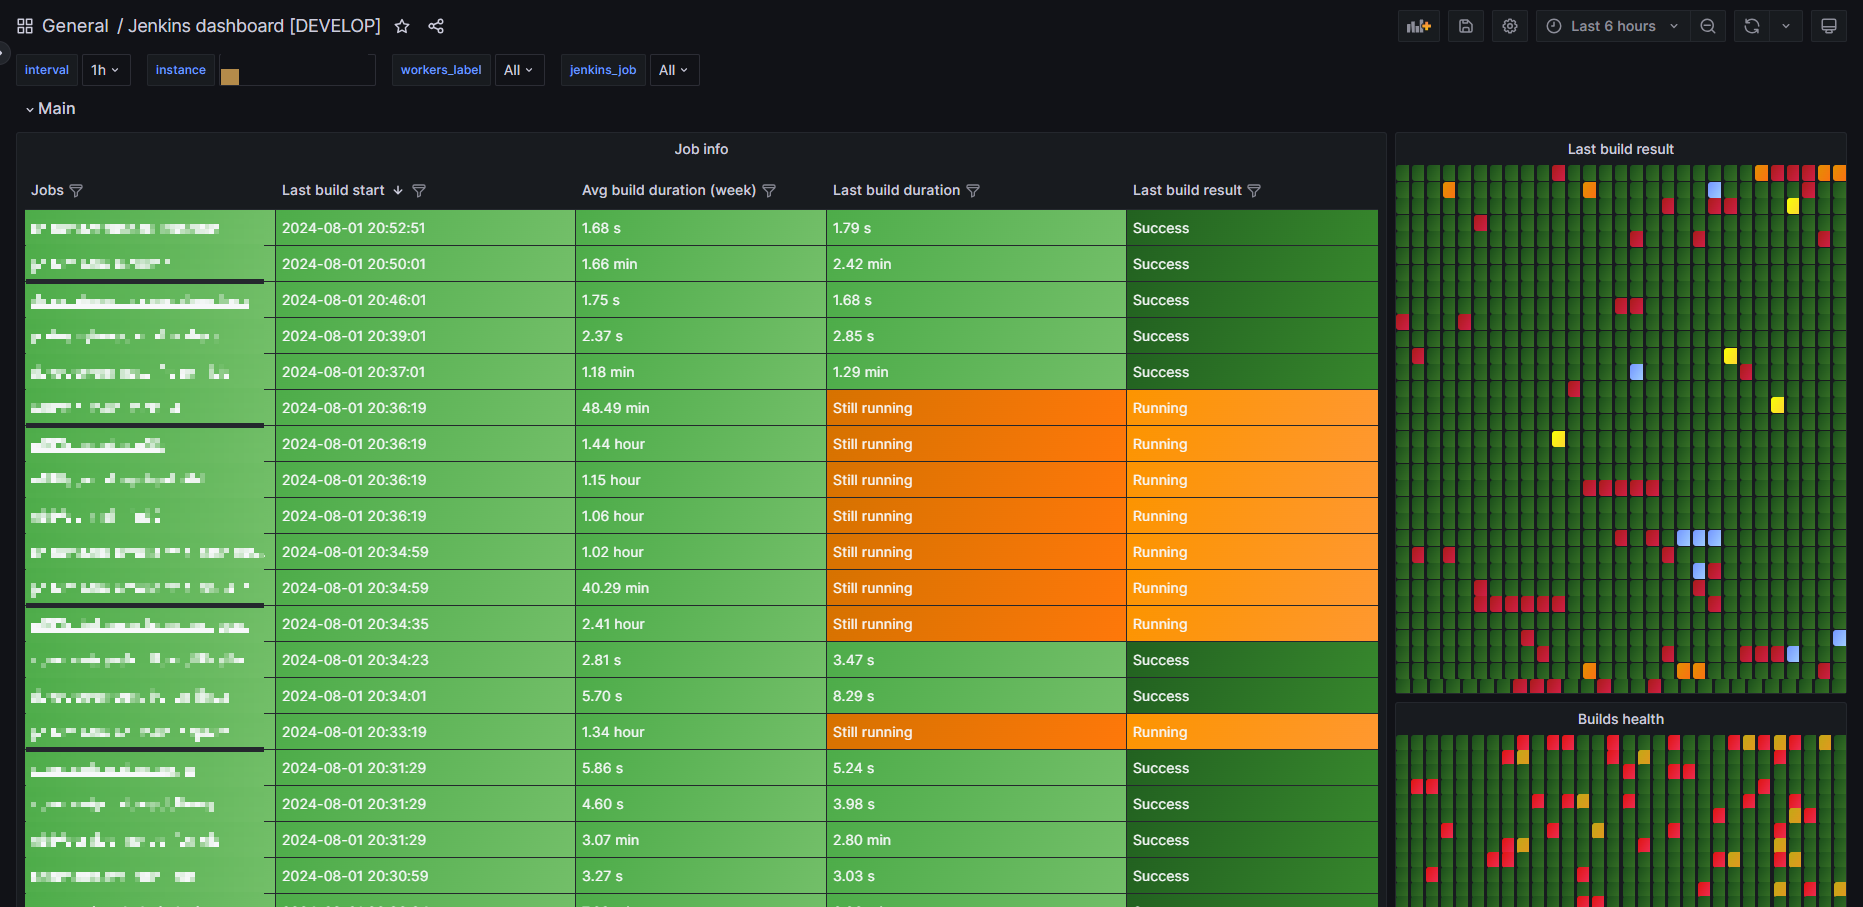
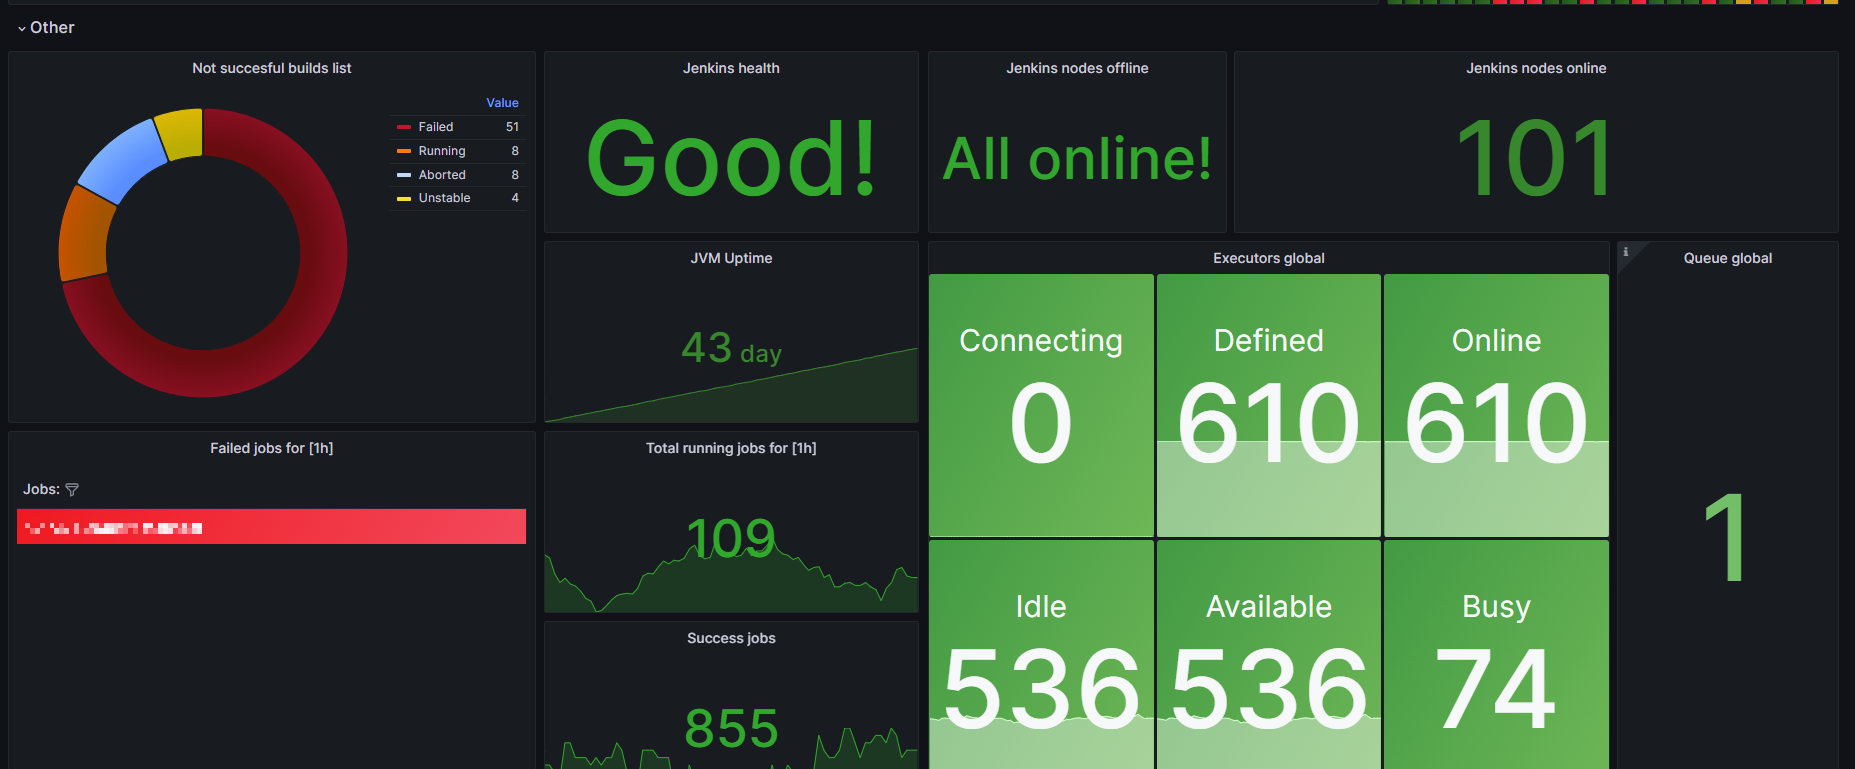
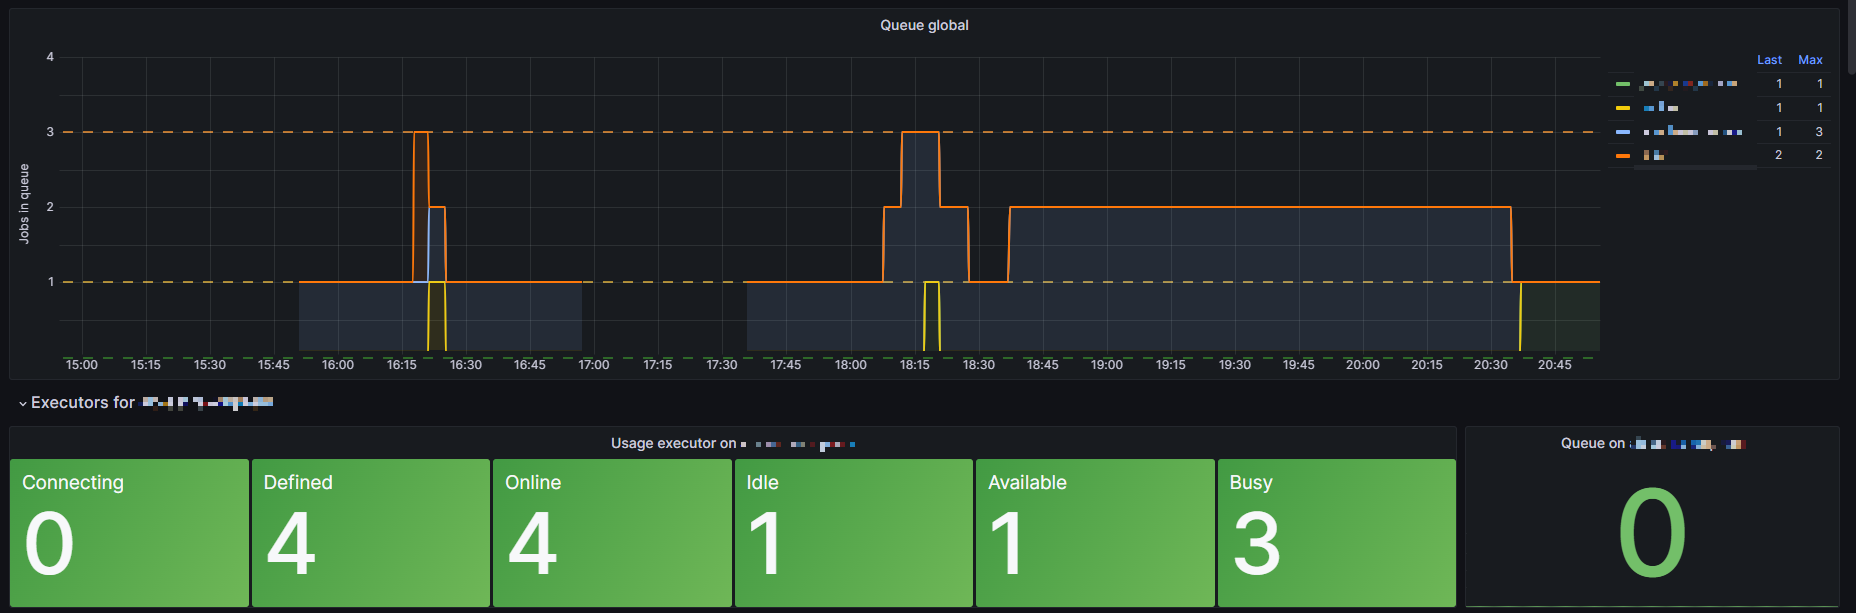
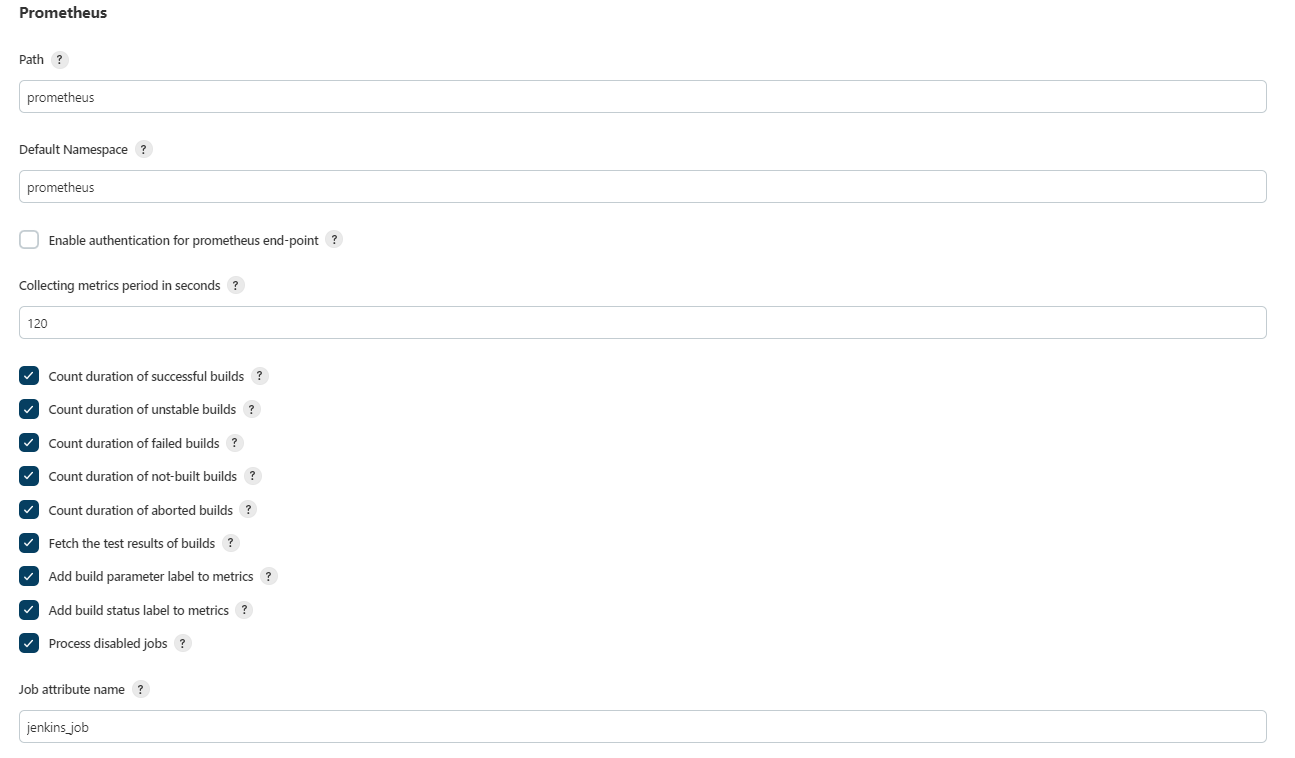
The dashboard displays the status of your Jenkins jobs, the status of the queue on executors, and a few other things. The metrics you get are taken from the Prometheus plugin for your Jenkins.
Screenshots
Used Metrics 2121
interval
interval:
jenkins_health_check_score
jenkins_job
jenkins_node_builds_count
jenkins_node_offline_value
jenkins_node_online_value
job
job_url
prometheus_jenkins_builds_health_score
prometheus_jenkins_builds_last_build_duration_milliseconds
prometheus_jenkins_builds_last_build_result_ordinal
prometheus_jenkins_builds_last_build_start_time_milliseconds
prometheus_jenkins_executors_available
prometheus_jenkins_executors_busy
prometheus_jenkins_executors_connecting
prometheus_jenkins_executors_defined
prometheus_jenkins_executors_idle
prometheus_jenkins_executors_online
prometheus_jenkins_executors_queue_length
vm_uptime_milliseconds