Java Micrometer 5,2945,294 1.0 (1 reviews)
9/26/2017
11/1/2017
2
Host Metrics
>=4.6.0
Prometheus
Description
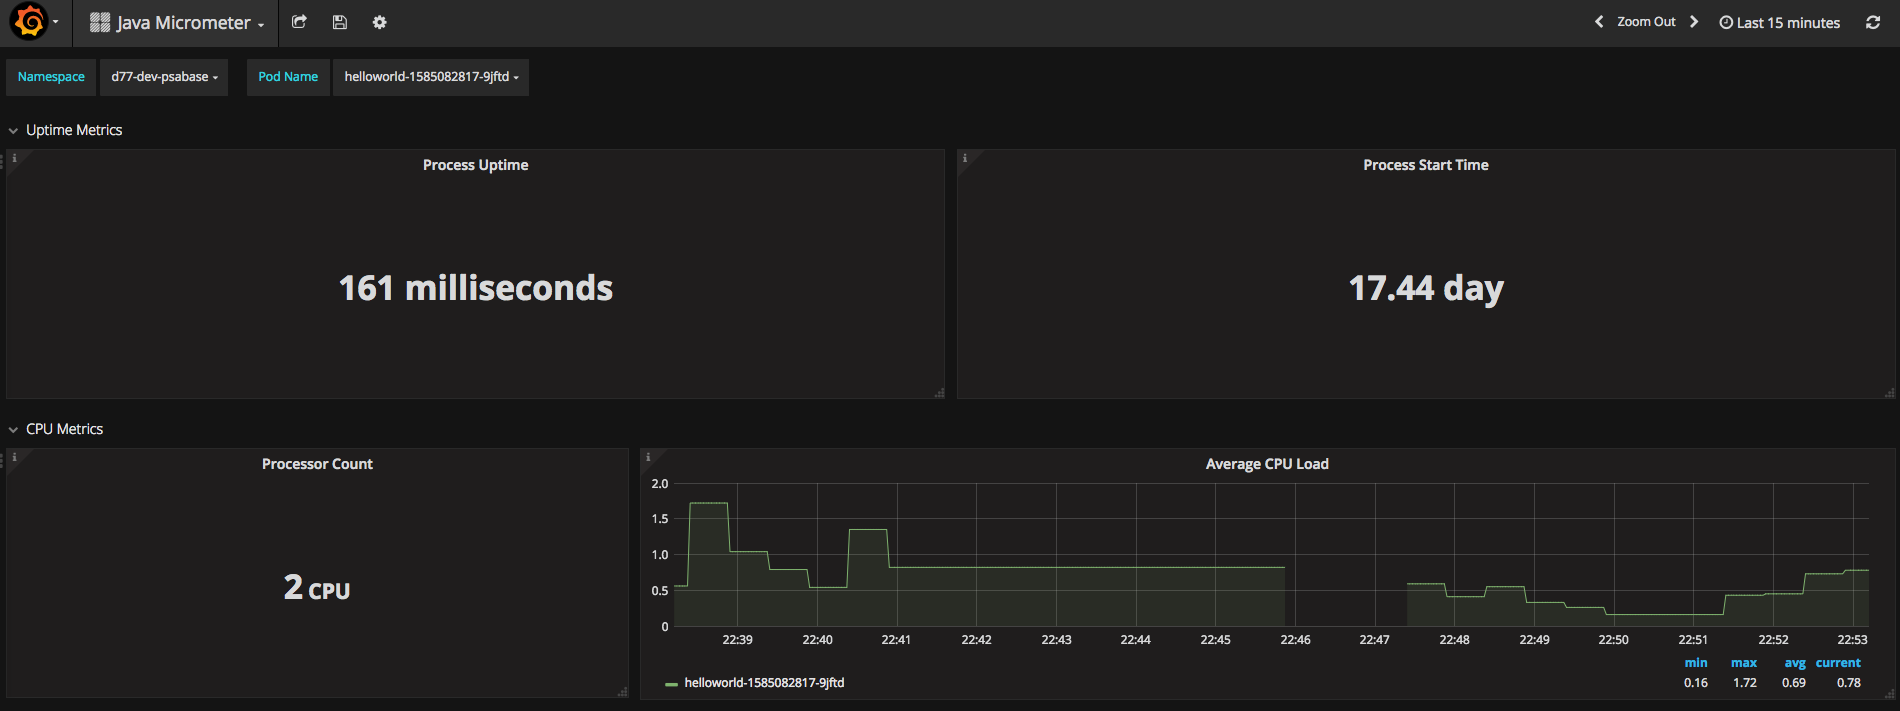
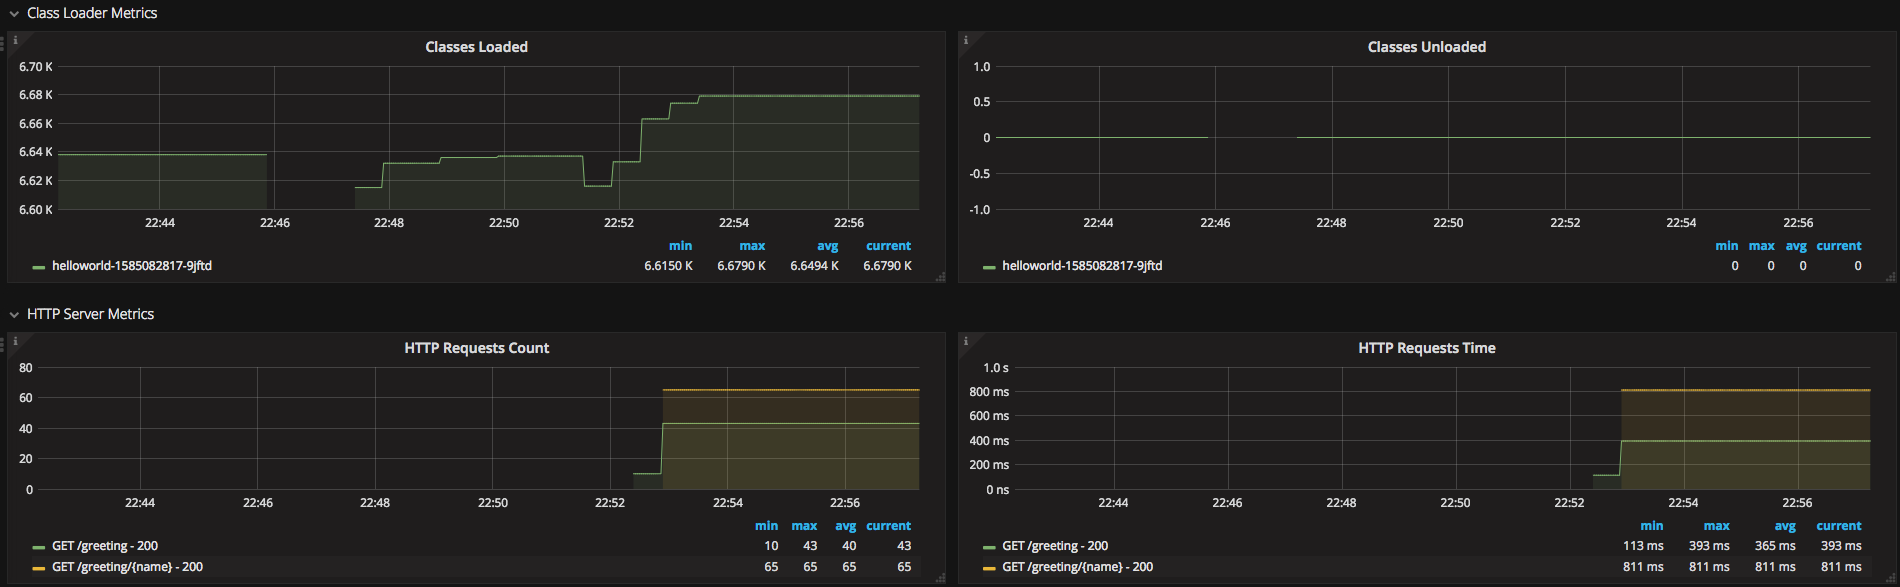
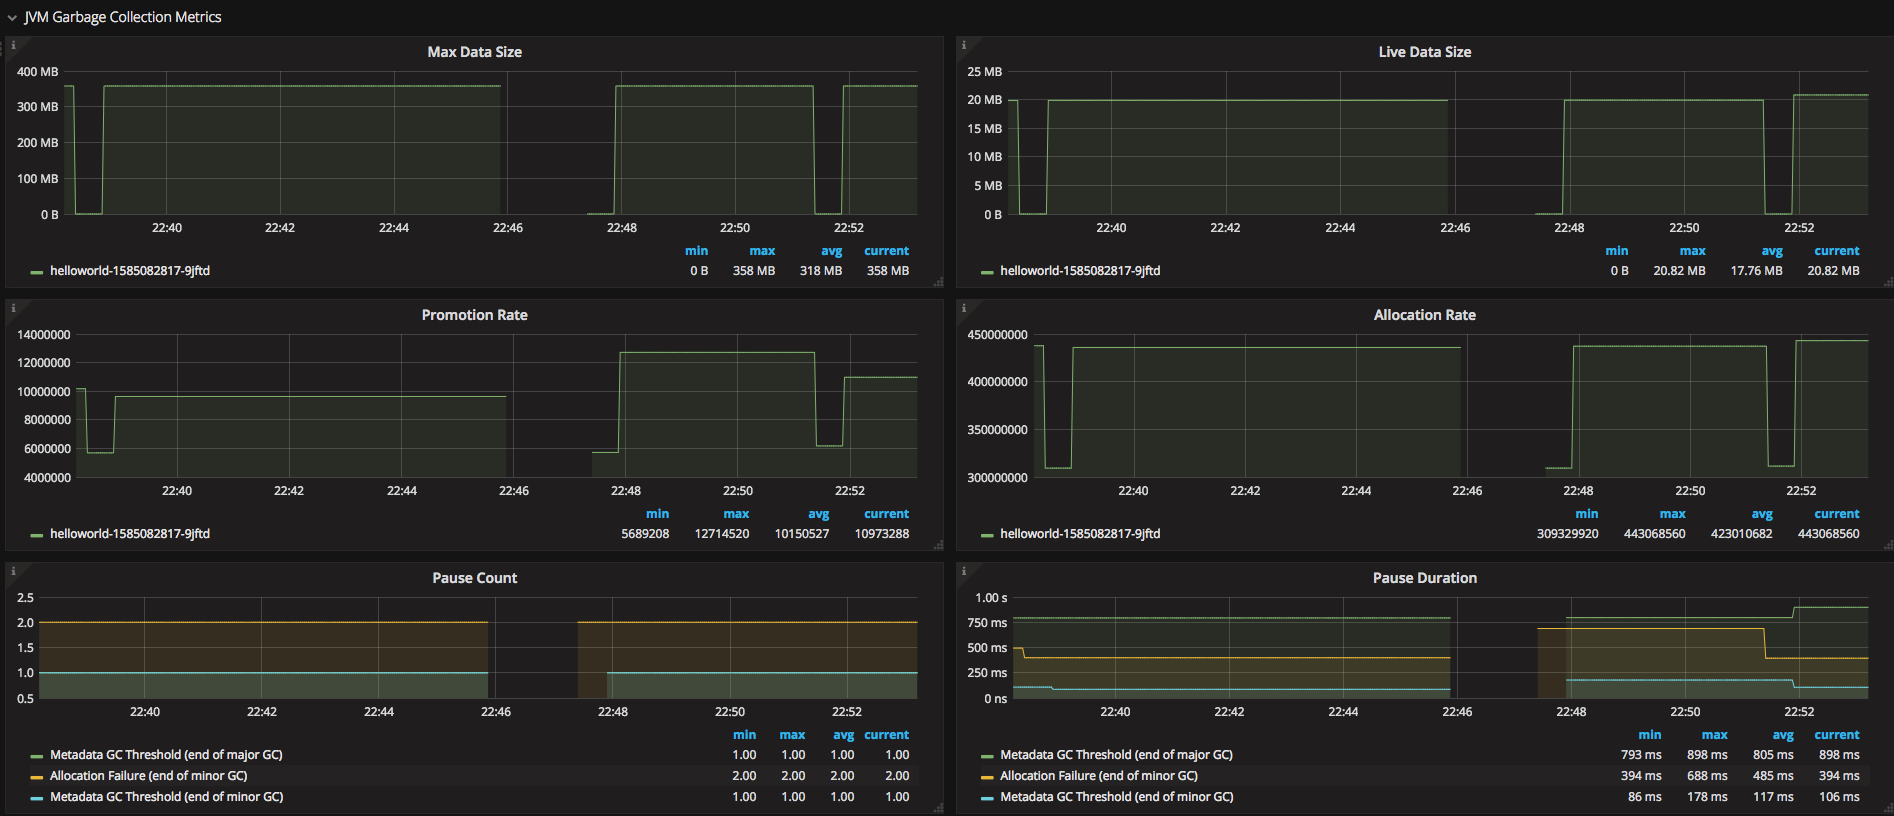
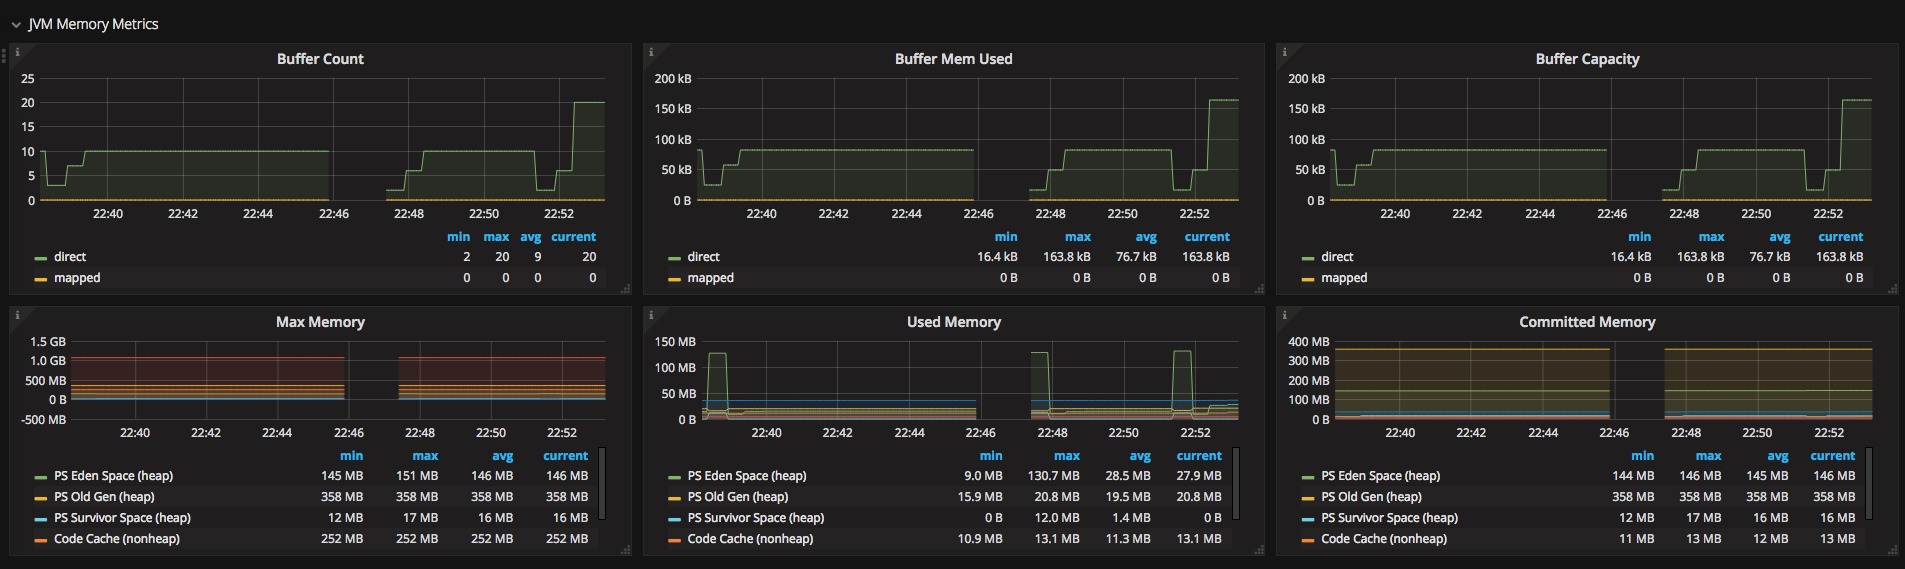
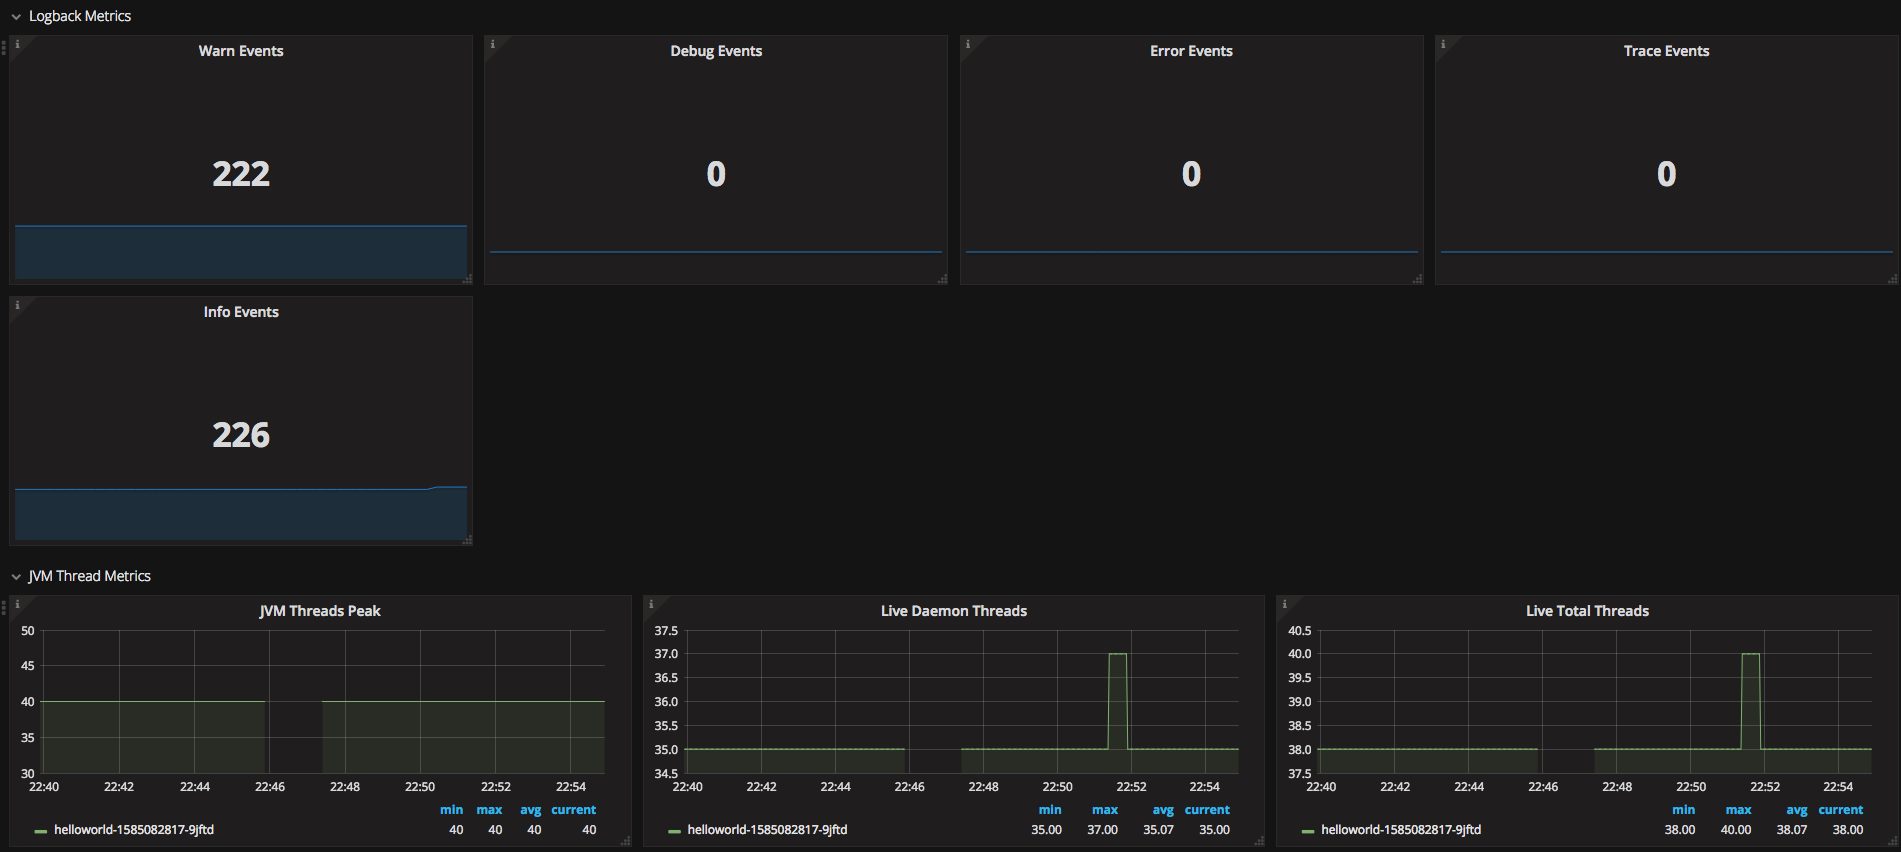
Java metrics exposed with Micrometer
Screenshots
Get Dashboard✕
Download
Copy to Clipboard
Java metrics exposed with Micrometer