Jaeger-all-in-one 106,936106,936 5.0 (1 reviews)
Description
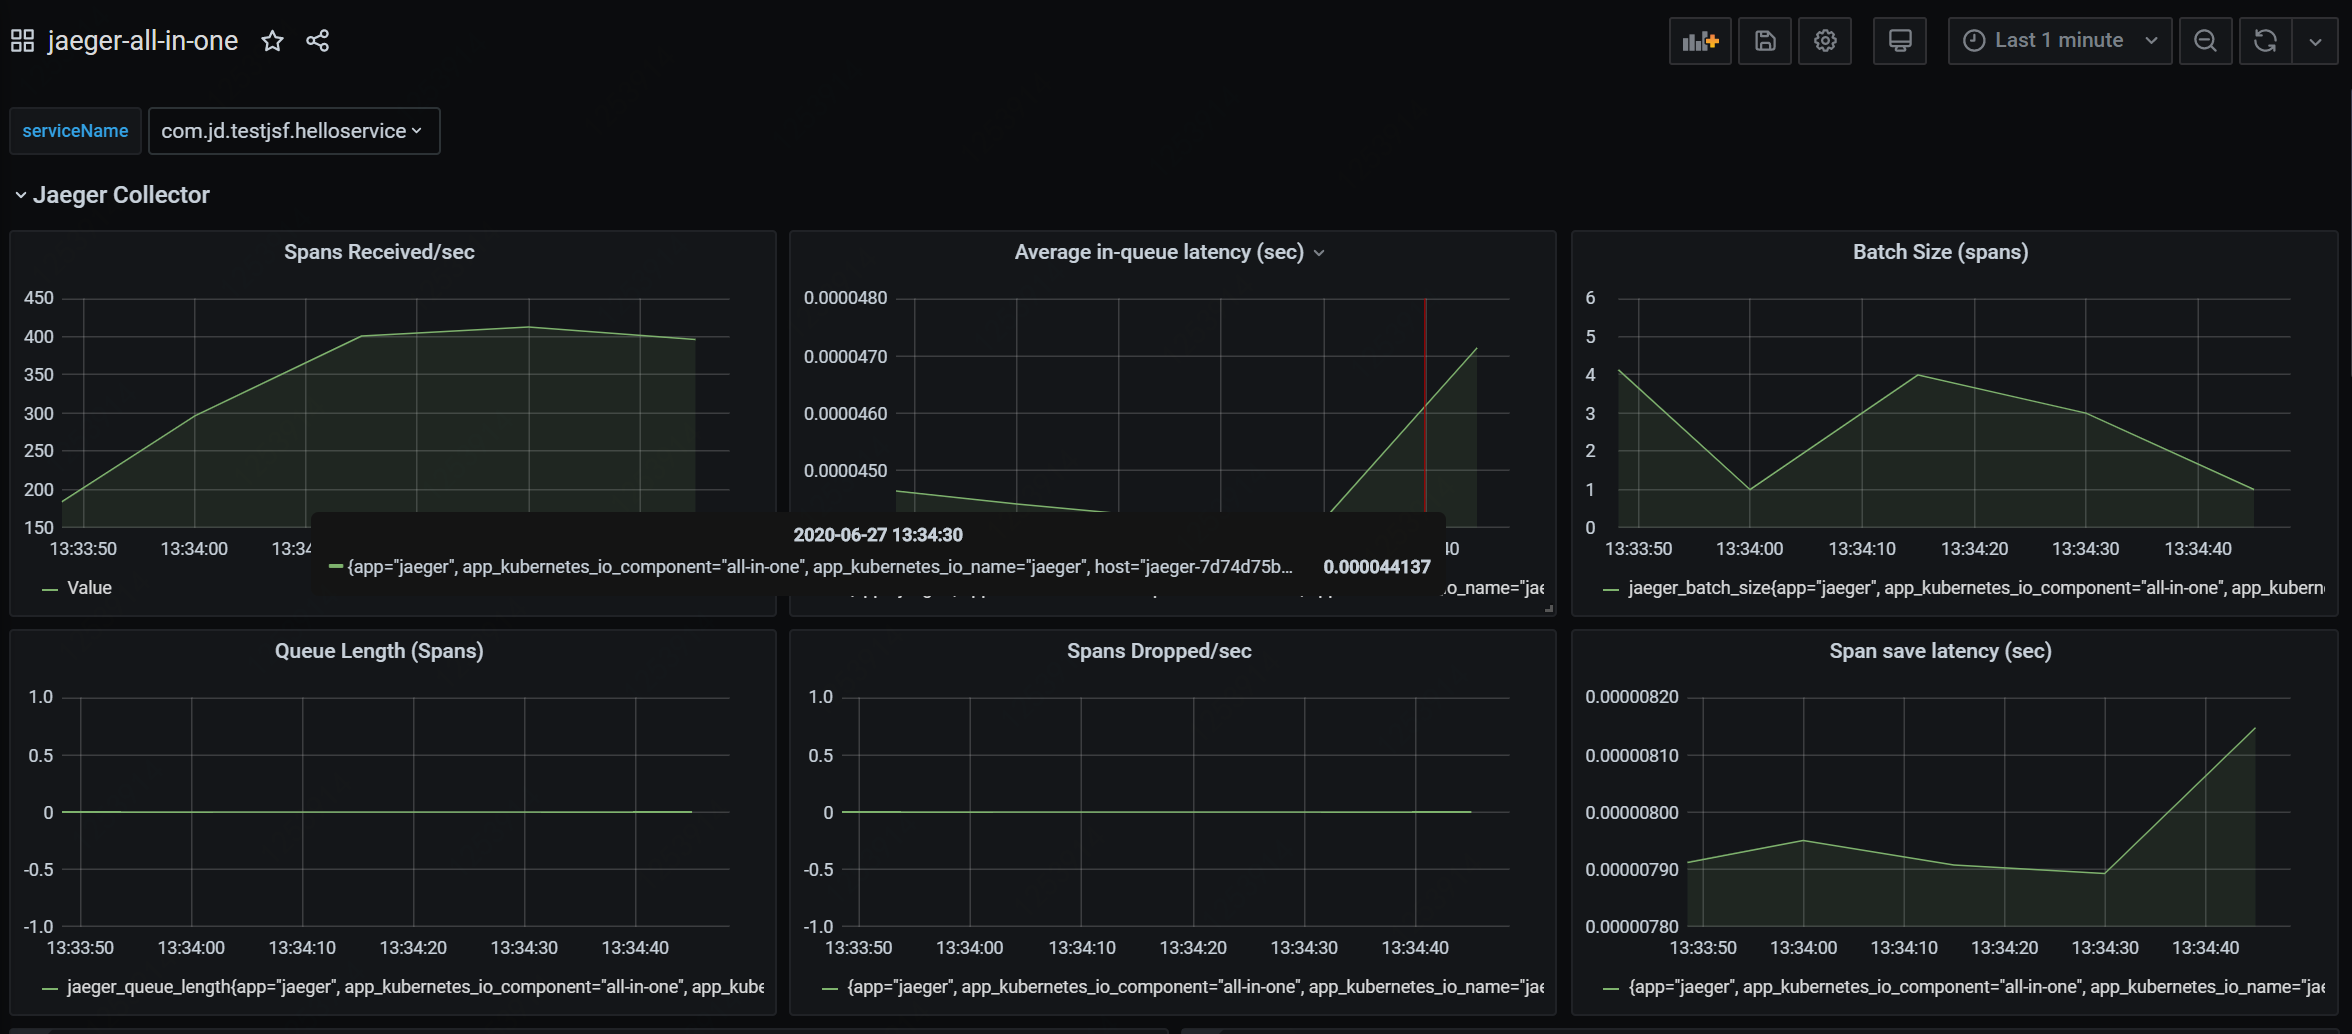
This dashboard monitors Jaeger performance end-to-end, focusing on tracing ingestion, queuing, and persistence latency and throughput. It highlights in-queue latency, save latency, and spans/trace throughput with panels like jaeger_in_queue_latency_sum / jaeger_in_queue_latency_count, jaeger_save_latency_sum / jaeger_save_latency_count, and jaeger_spans_received_total alongside batch and queue metrics such as jaeger_batch_size, jaeger_queue_length, and jaeger_spans_dropped_total. Together, these visuals help identify bottlenecks in ingestion, batching, and reliable persistence of traces across the Jaeger pipeline.
Screenshots
Used Metrics 2828
jaeger_agent_collector_proxy_total
jaeger_agent_reporter_batch_size
jaeger_agent_reporter_batches_failures_total
jaeger_agent_reporter_batches_submitted_total
jaeger_agent_reporter_spans_failures_total
jaeger_agent_reporter_spans_submitted_total
jaeger_batch_size
jaeger_http_server_errors_total
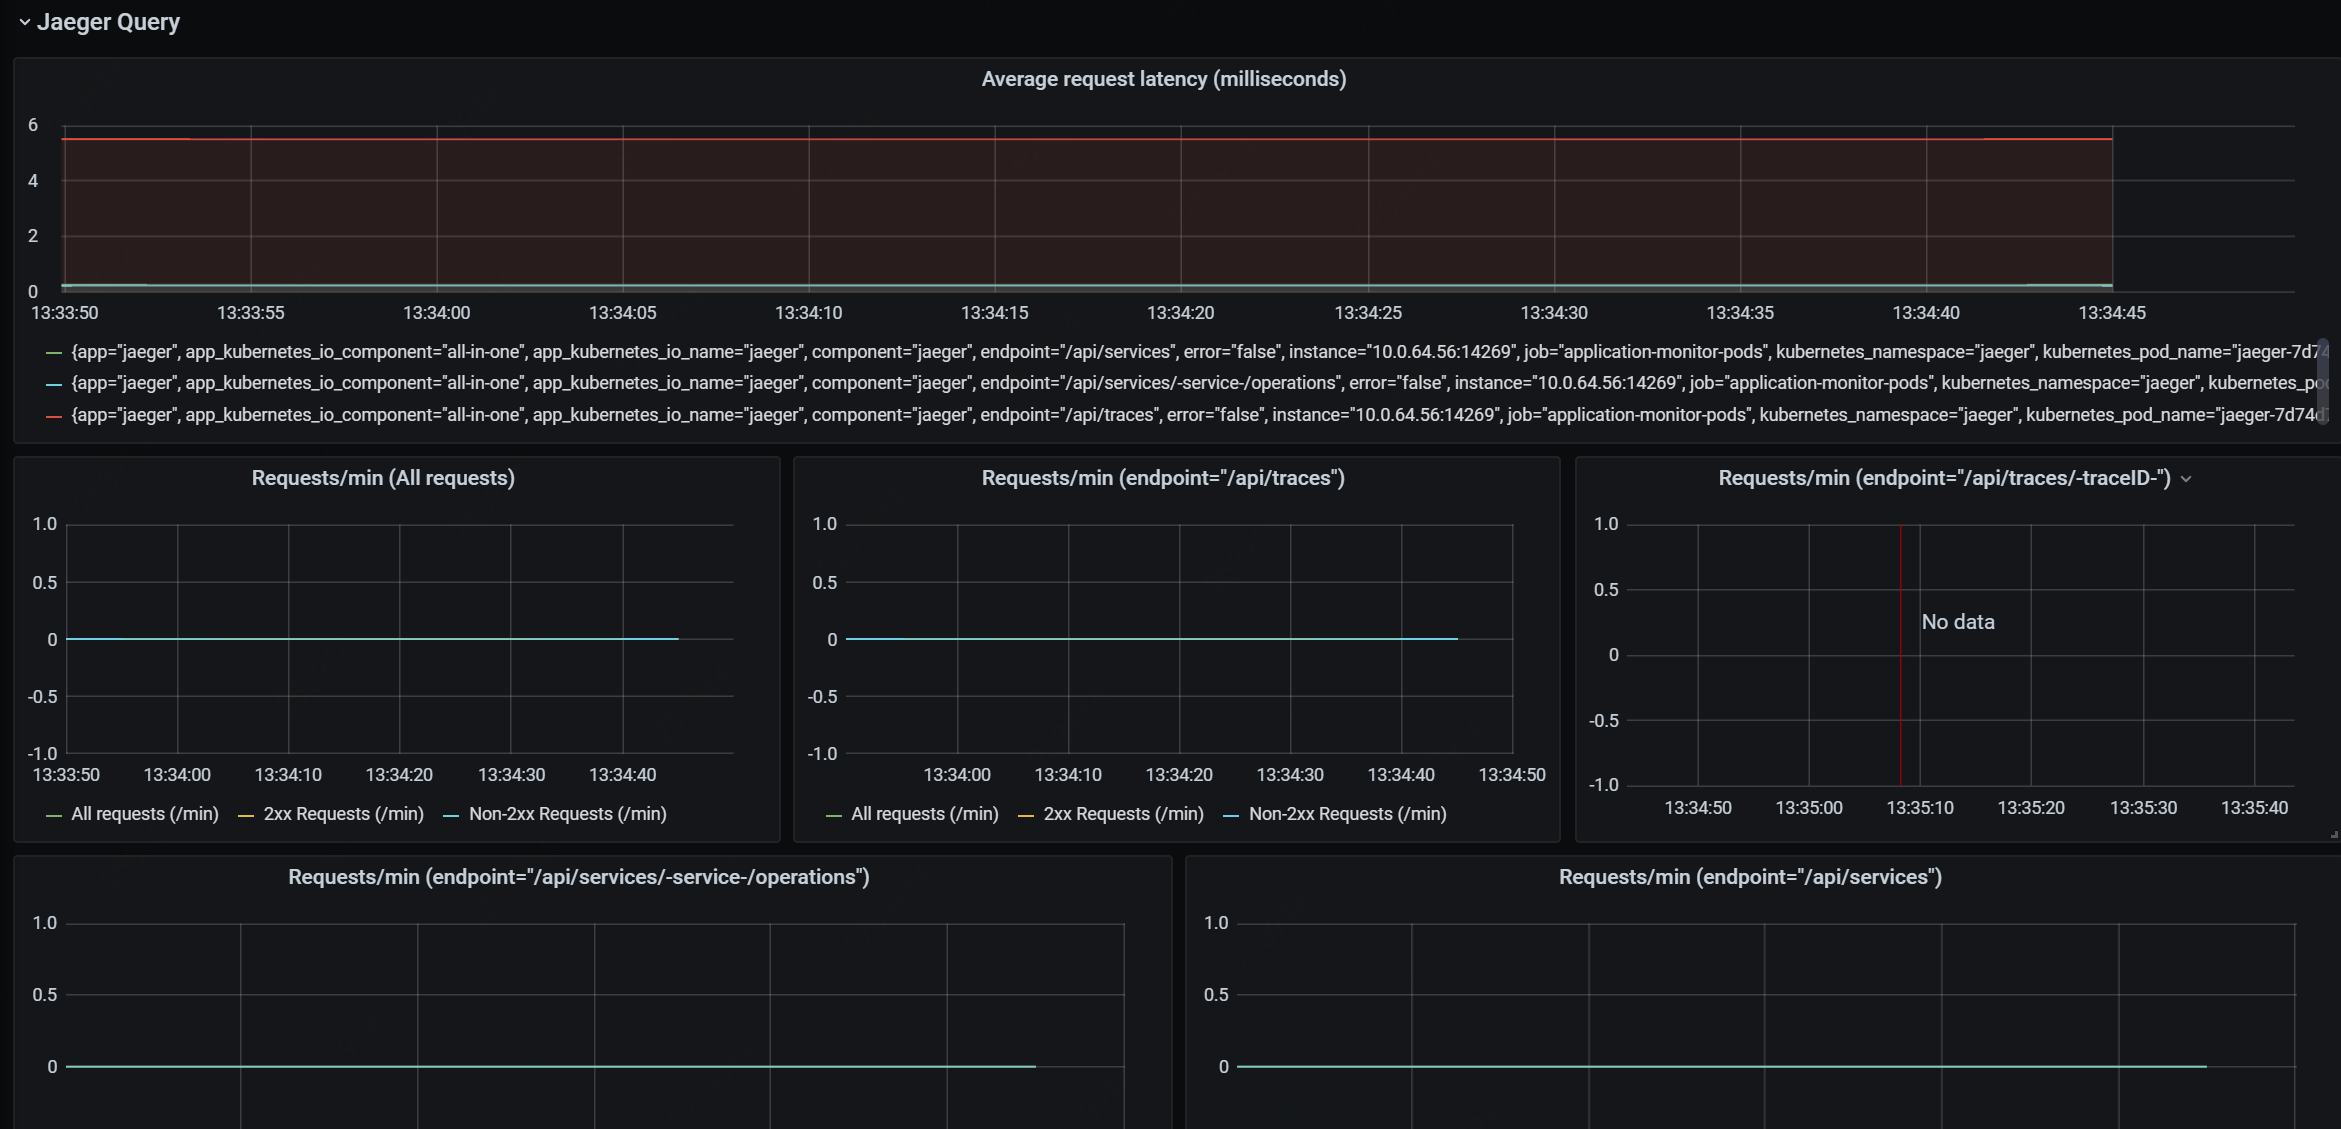
jaeger_http_server_requests_total
jaeger_in_queue_latency_count
jaeger_in_queue_latency_sum
jaeger_queue_length
jaeger_rpc_http_requests_total
jaeger_rpc_request_latency_count
jaeger_rpc_request_latency_sum
jaeger_save_latency_count
jaeger_save_latency_sum
jaeger_spans_dropped_total
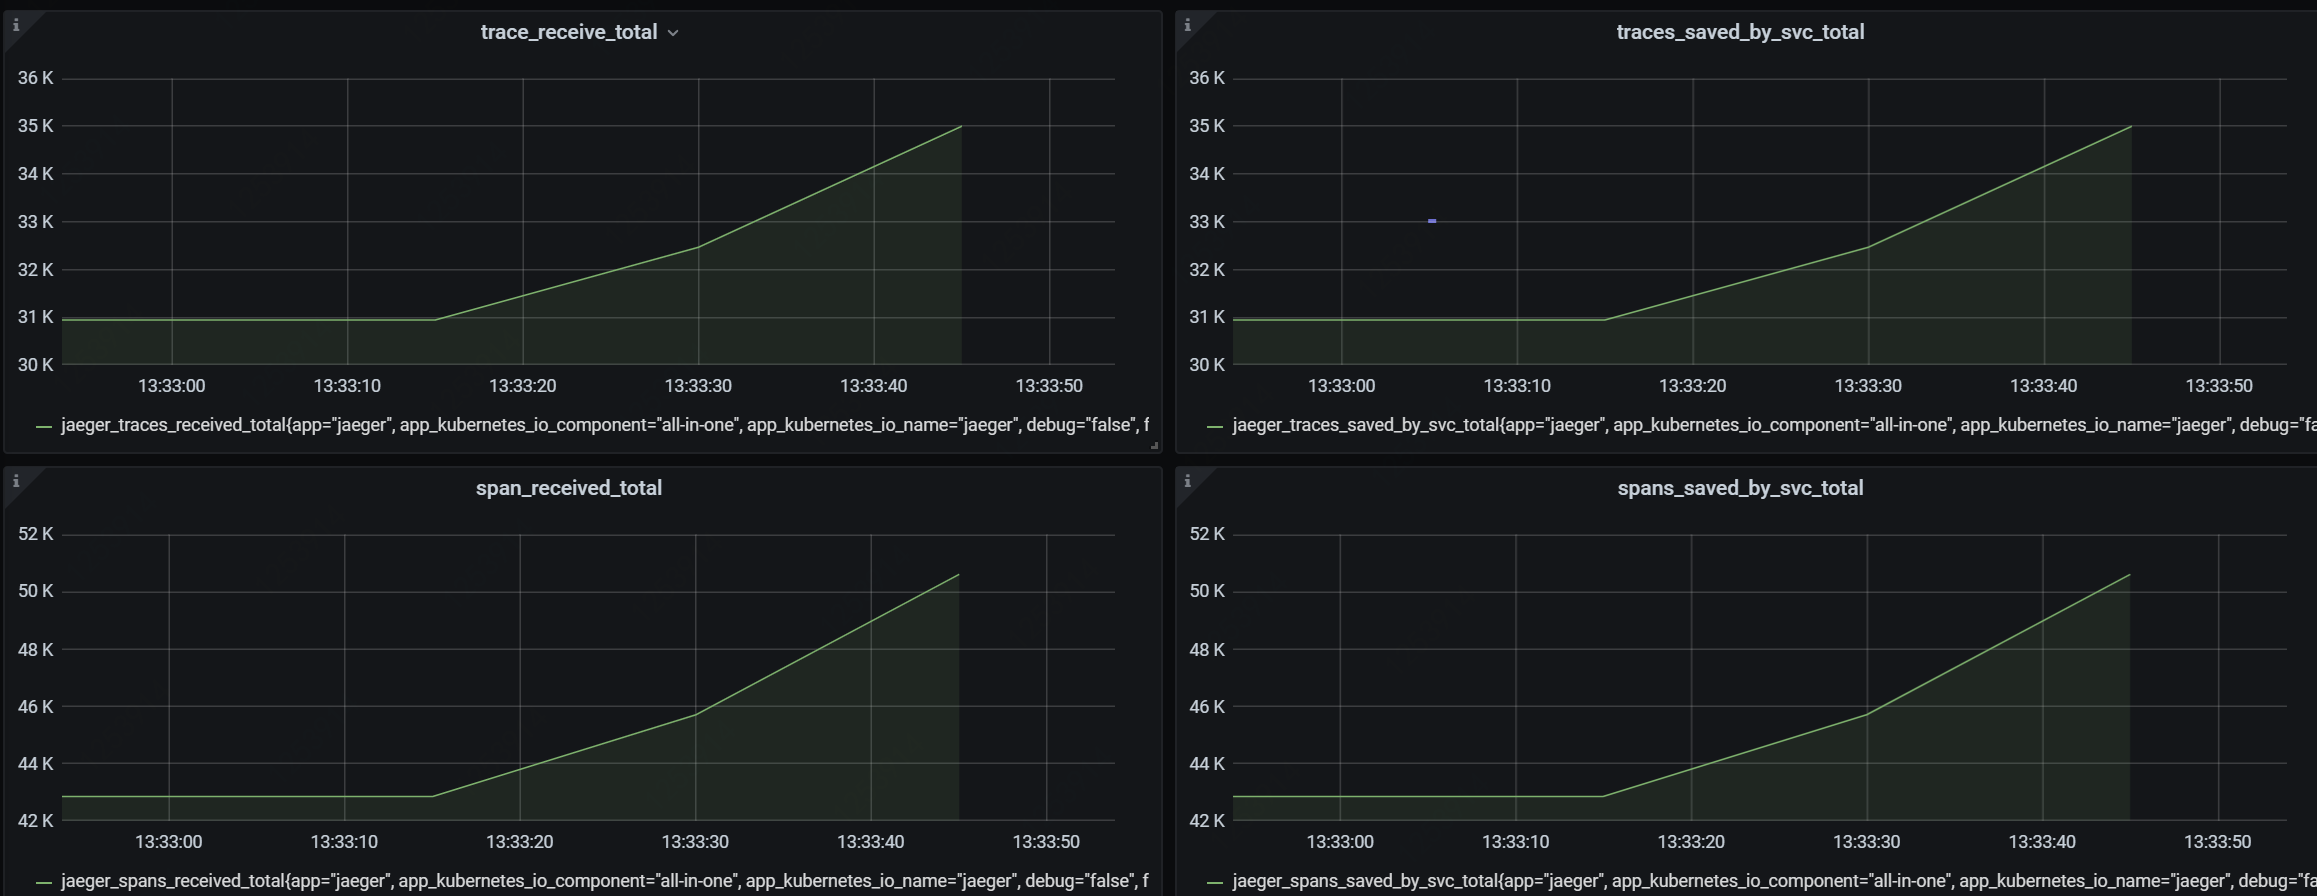
jaeger_spans_received_total
jaeger_spans_saved_by_svc_total
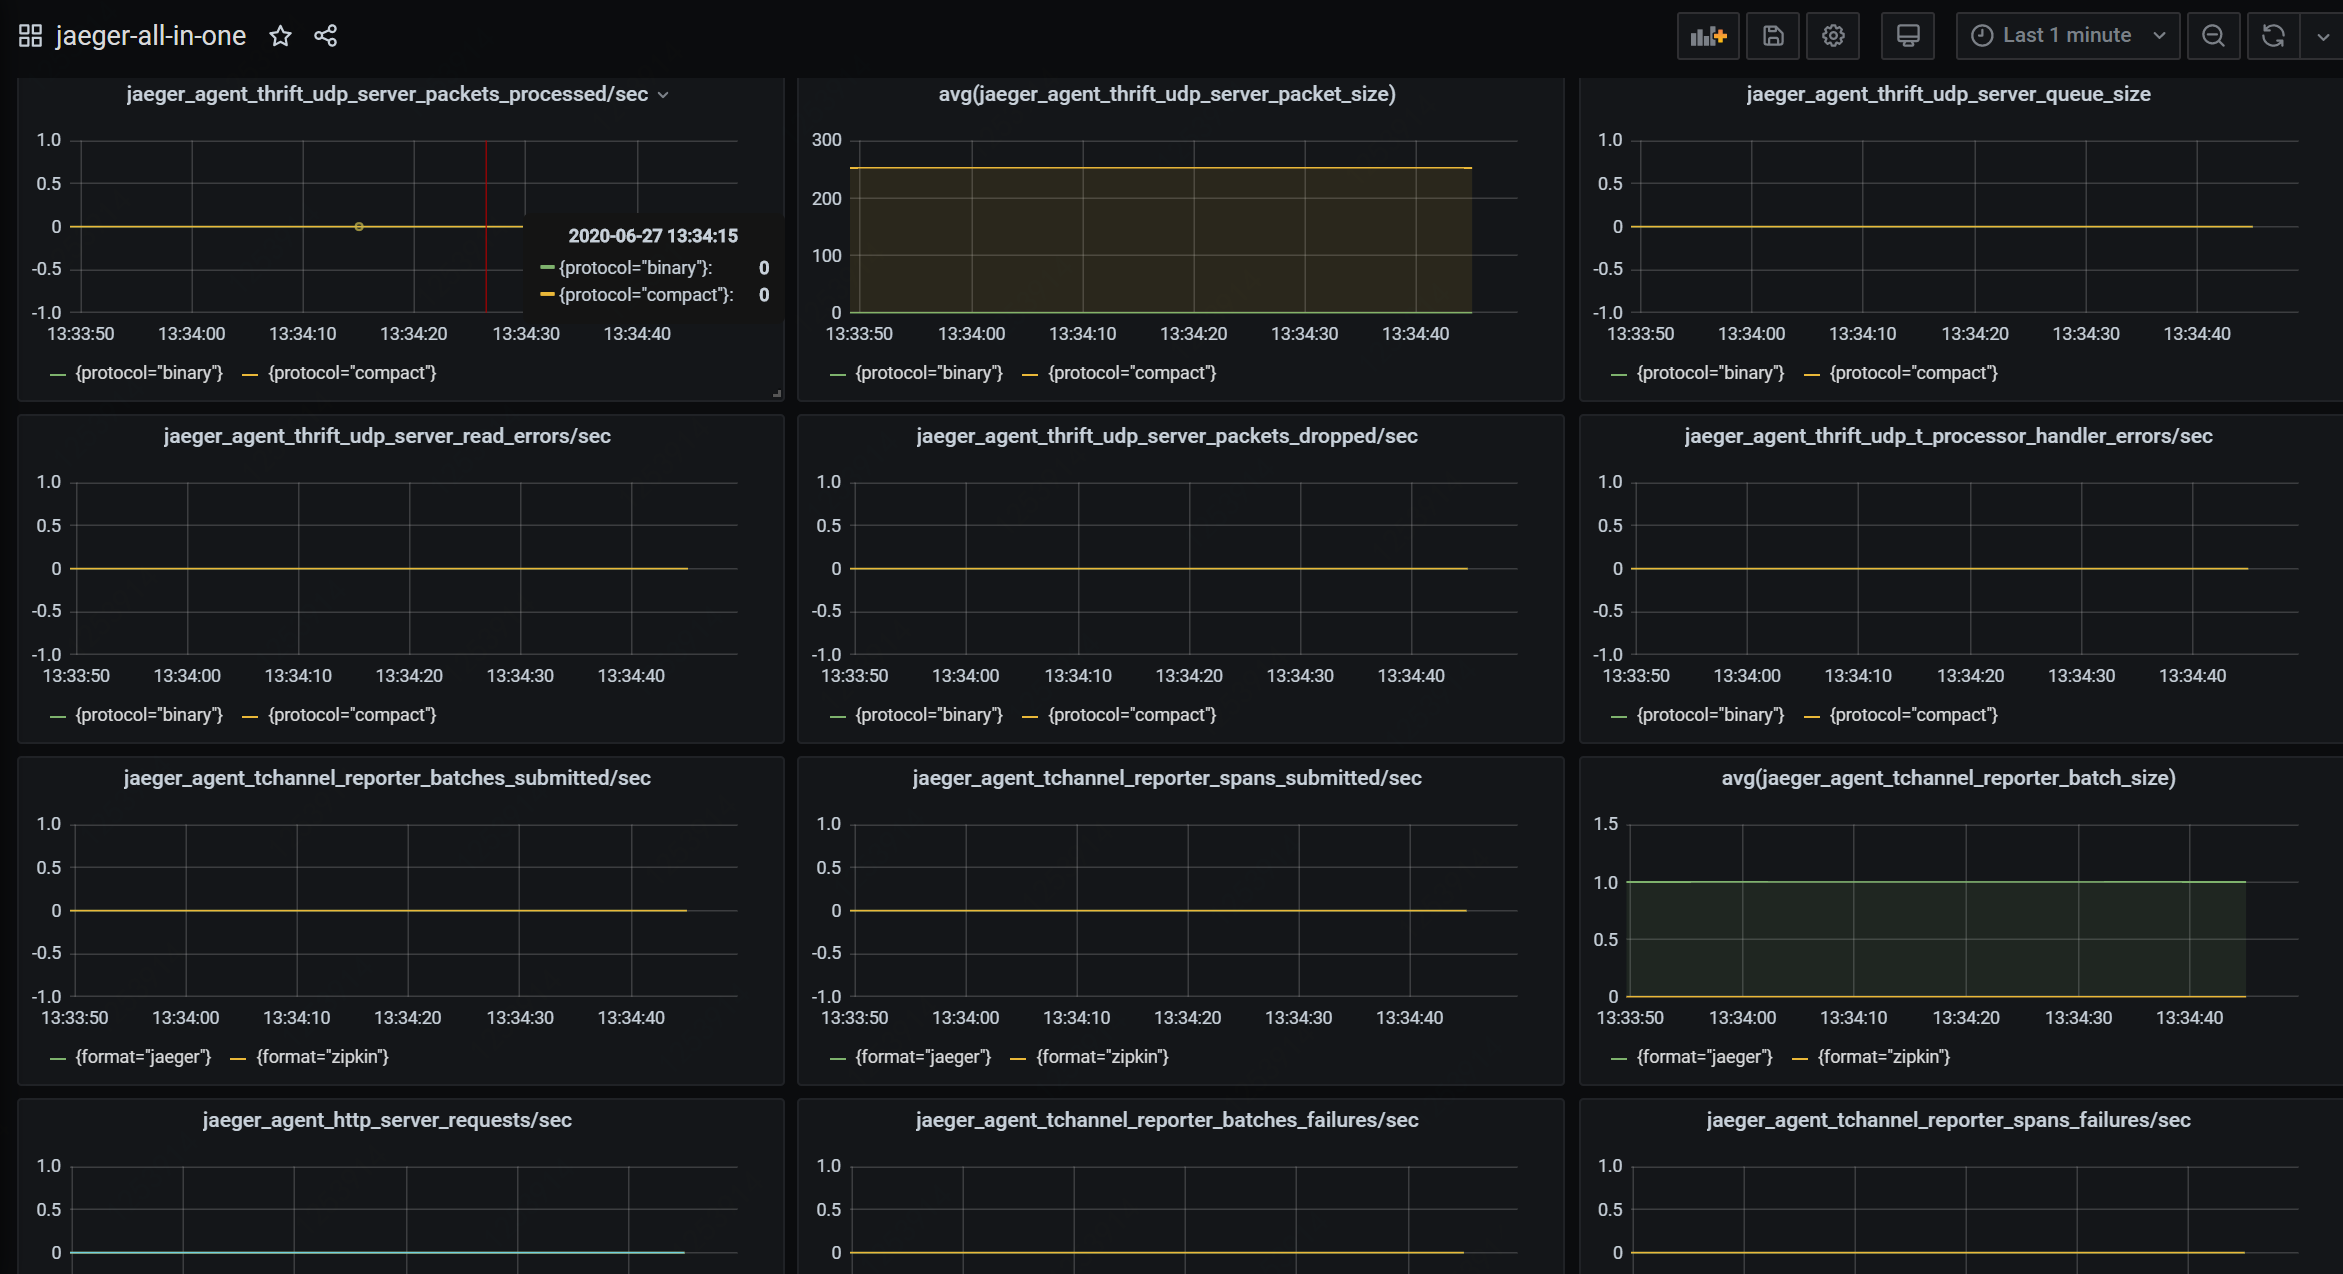
jaeger_thrift_udp_server_packet_size
jaeger_thrift_udp_server_packets_dropped_total
jaeger_thrift_udp_server_packets_processed_total
jaeger_thrift_udp_server_queue_size
jaeger_thrift_udp_server_read_errors_total
jaeger_thrift_udp_t_processor_handler_errors_total
jaeger_traces_received_total
jaeger_traces_saved_by_svc_total