Internal Kubernetes Routes 11,29711,297
3/16/2024
3/16/2024
2
>=10.3.3
Prometheus
Description
Monitor Routes from one Node to another
Screenshots
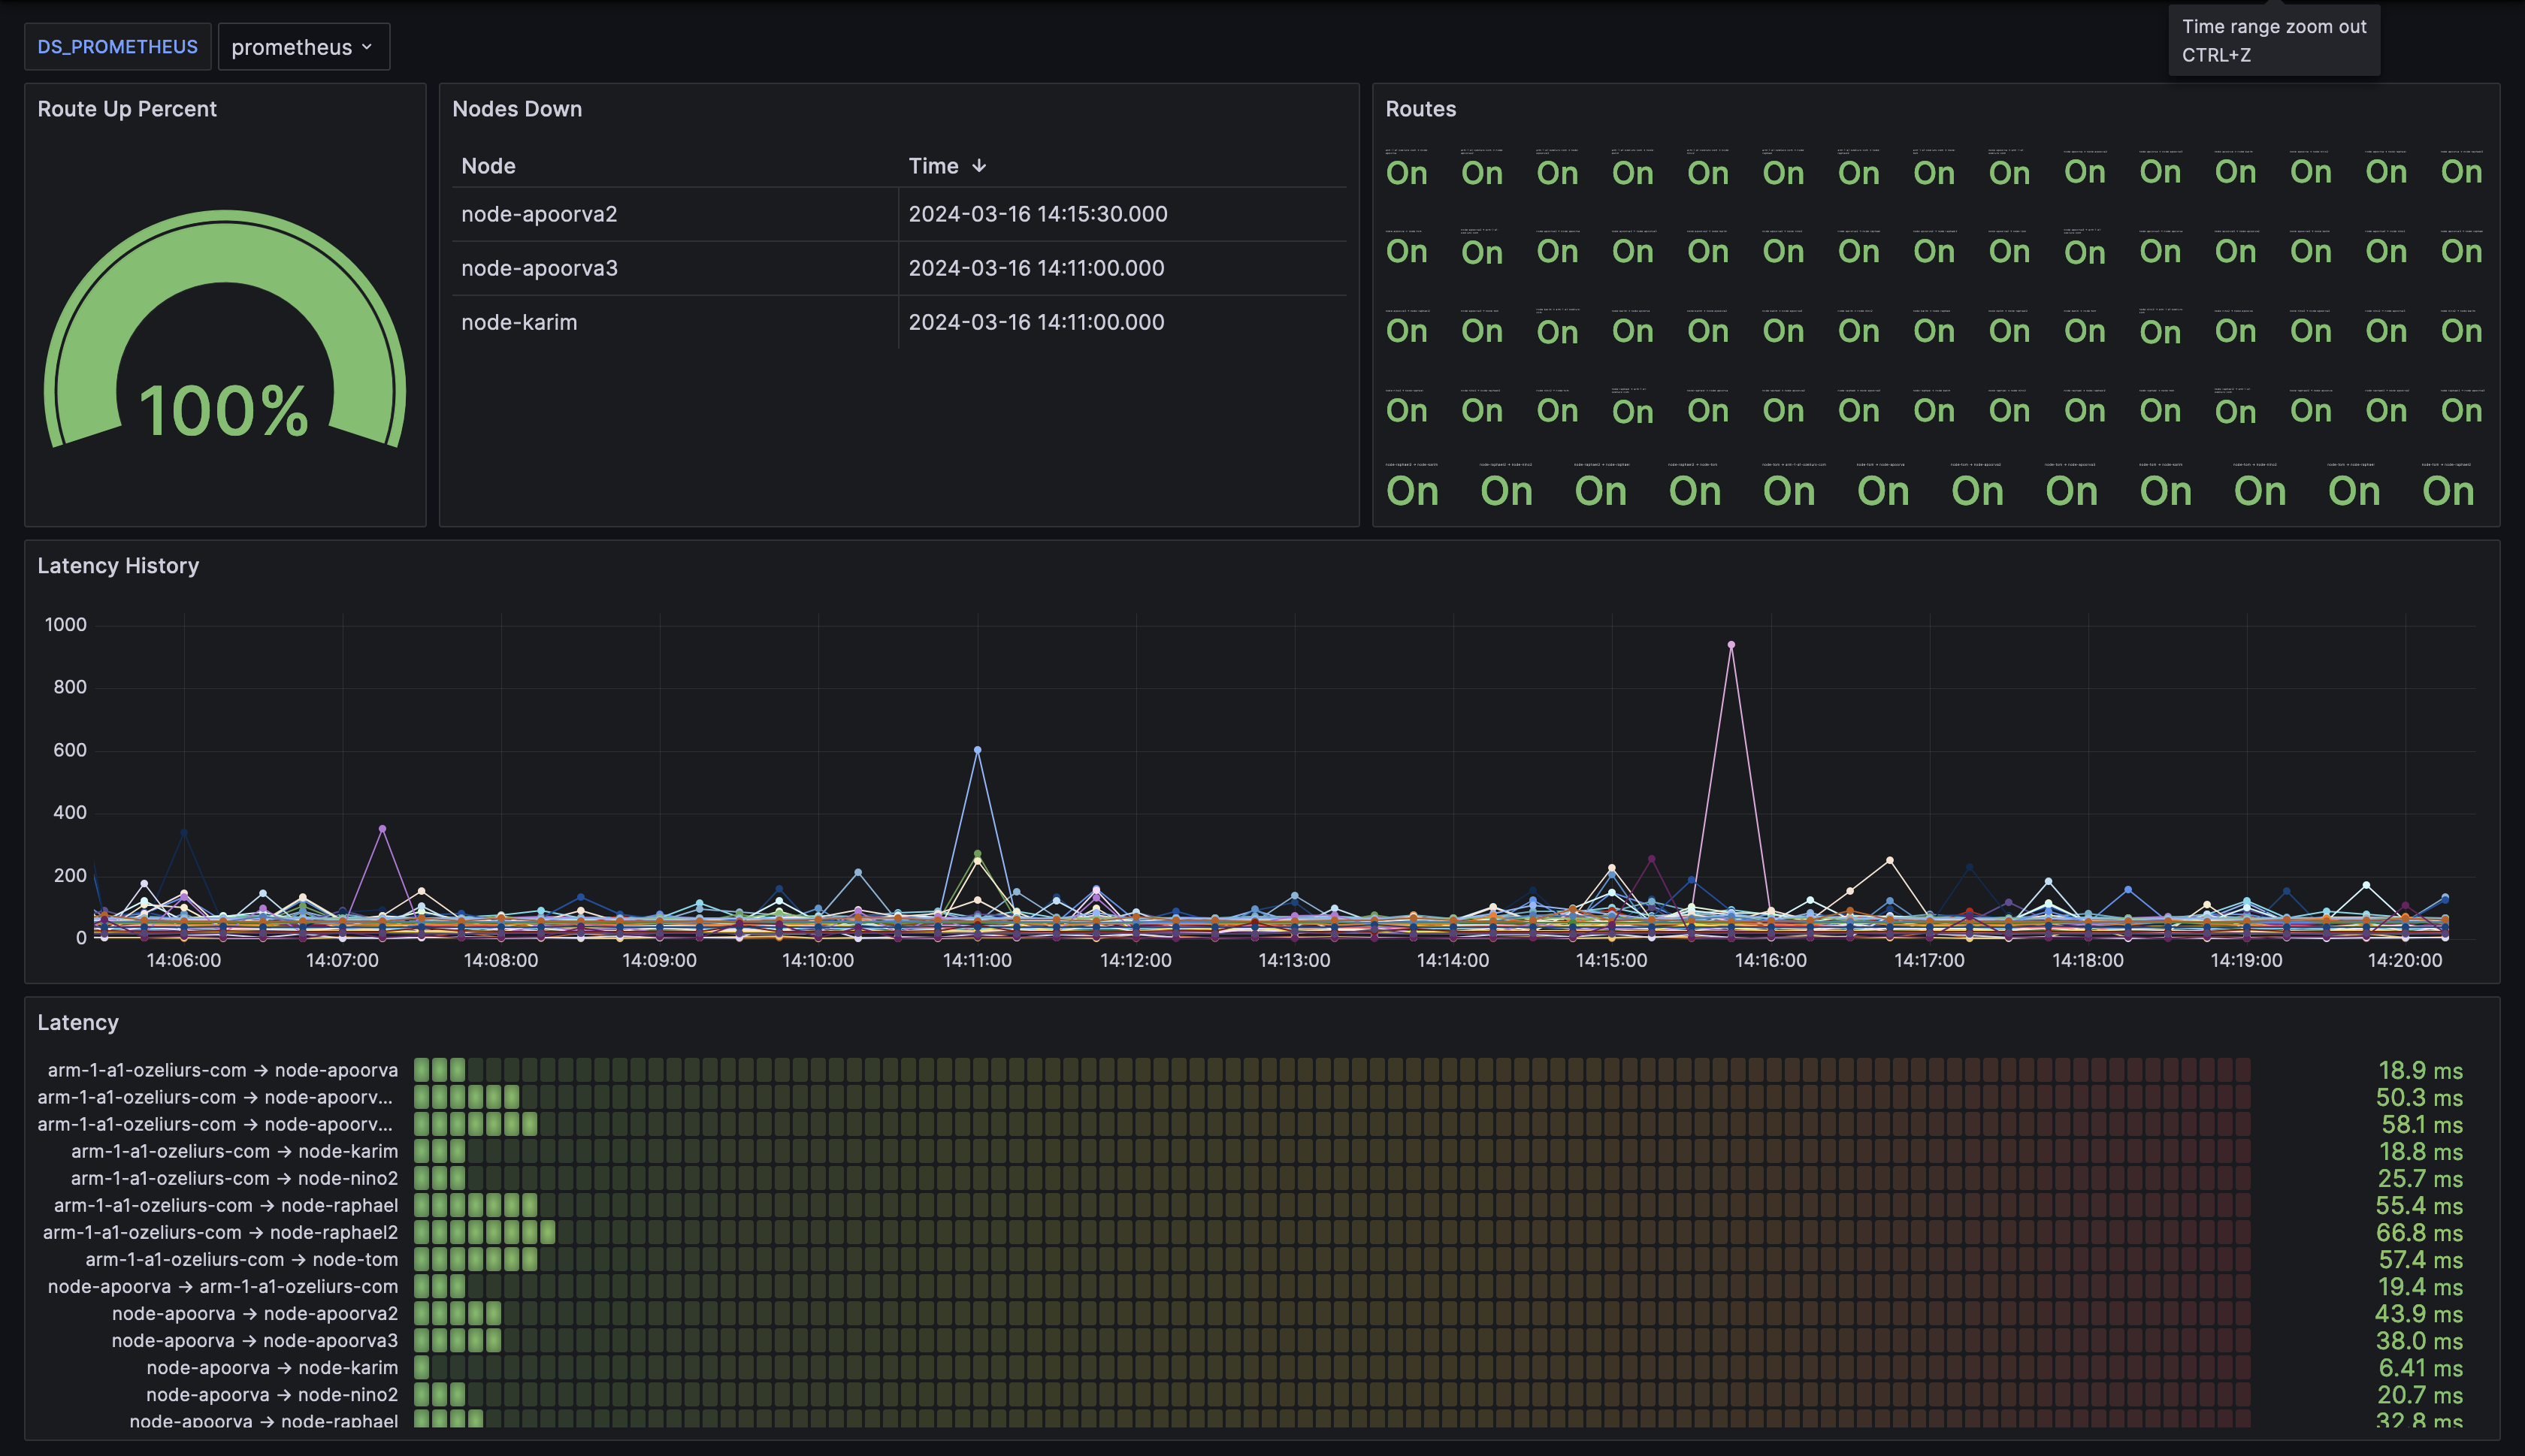
Used Metrics 22
k_network_available
k_network_latency
Get Dashboard✕
Download
Copy to Clipboard