InfluxDB Internals Dashboard 1,2741,274 5.0 (1 reviews)
10/23/2019
10/23/2019
1
Databases
>=6.4.2
Prometheus
Description
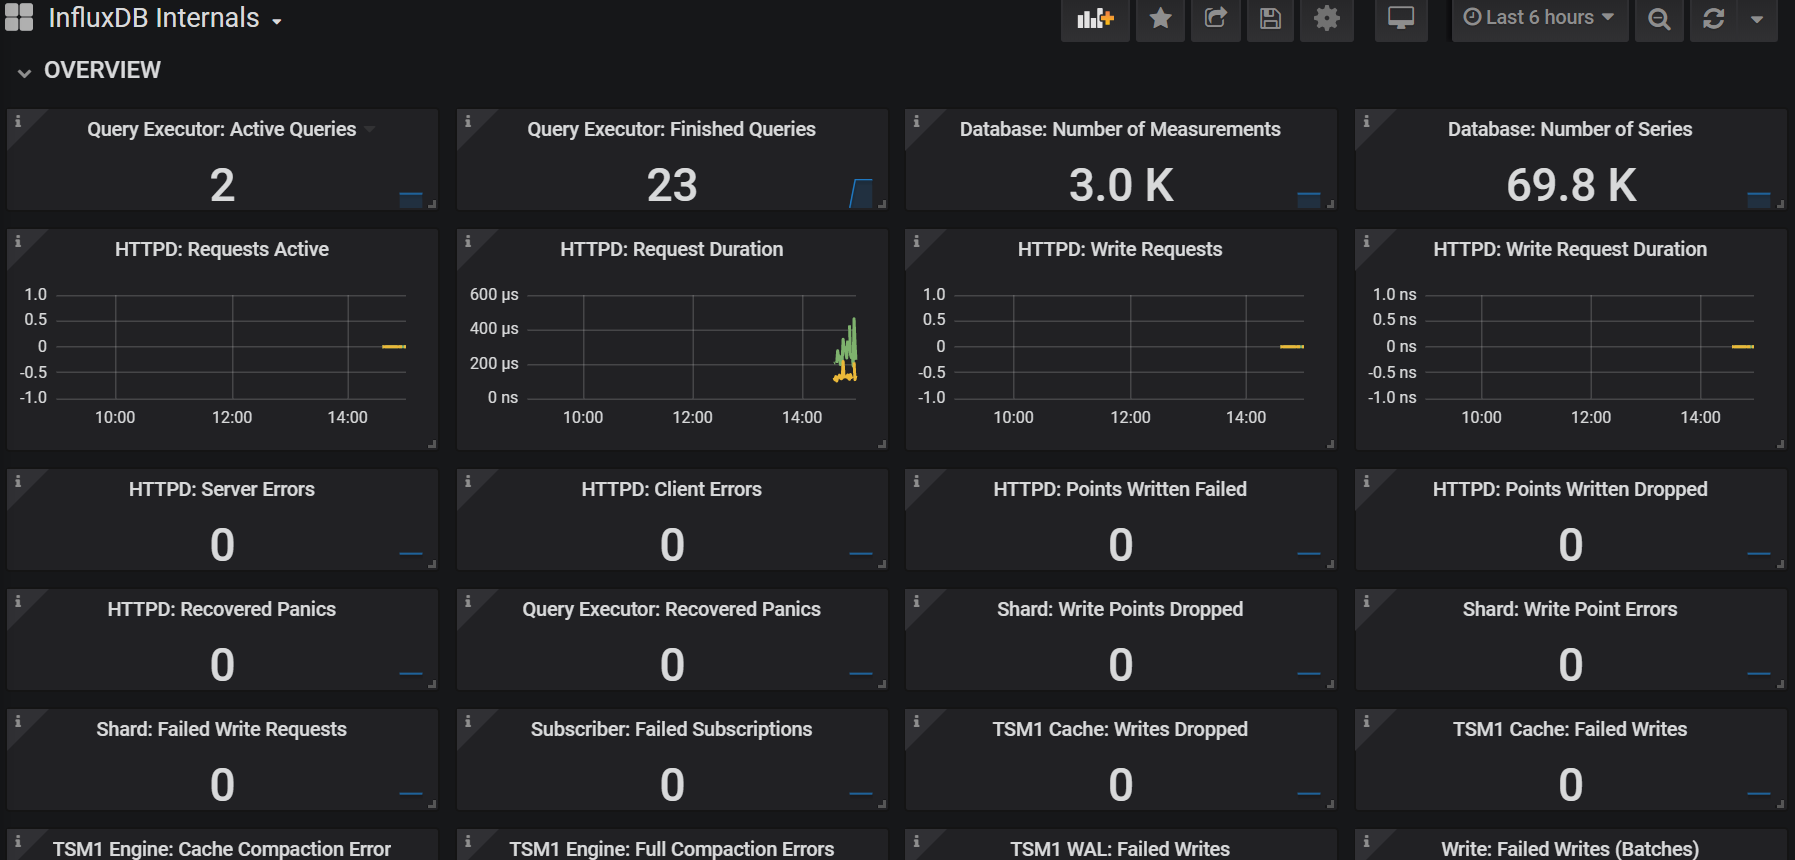
InfluxDB internal metrics display. It is a comprehensive dashboard of 124 panels that gives you a detailed understanding of your influx DB.
Screenshots
Get Dashboard✕
Download
Copy to Clipboard