iLO Dashboard 467,254467,254
5/11/2022
5/13/2022
3
Host Metrics
>=8.4.5
Prometheus
Description
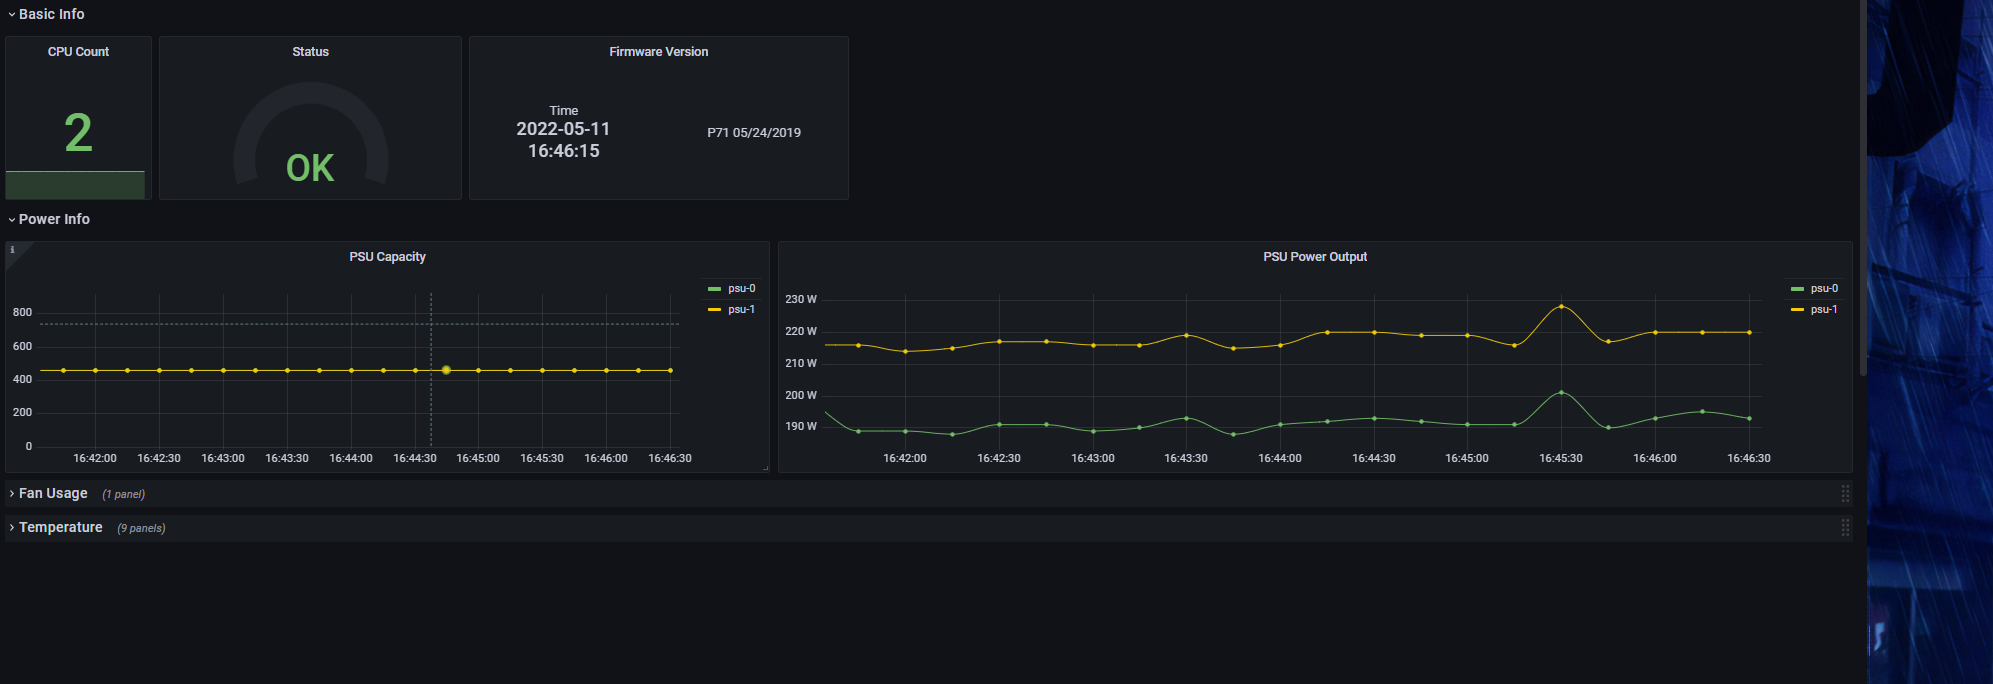
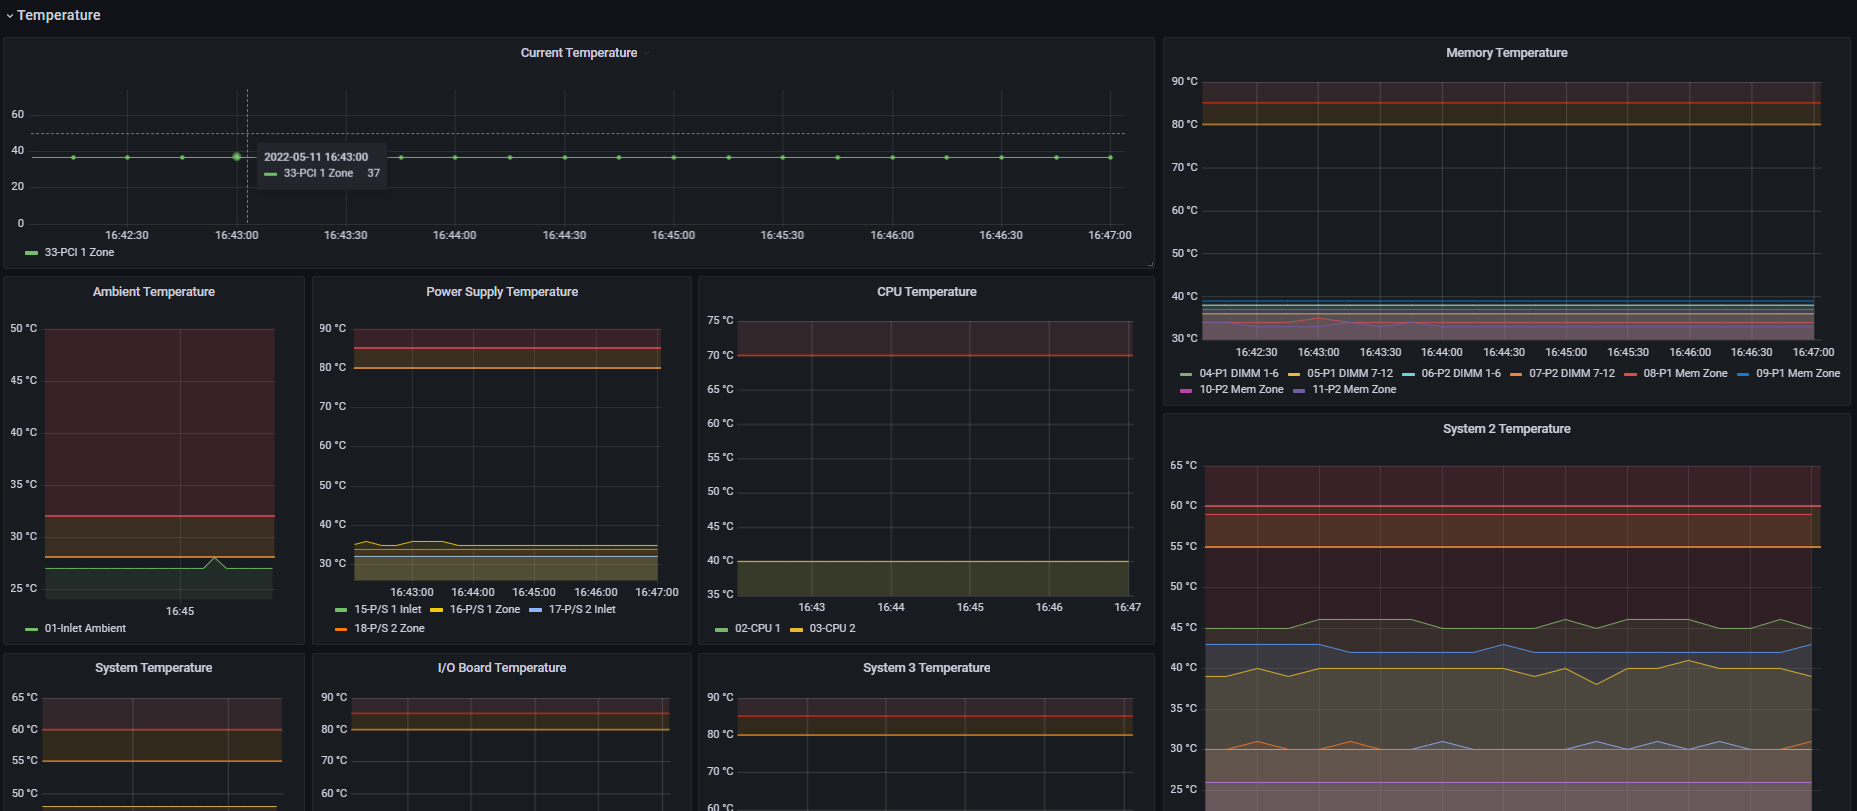
This dashboard monitors the health and hardware status of a server chassis using iDRAC metrics. It focuses on critical components such as CPU count and health, power metrics, and temperature readings across multiple system sensors. Key metrics include idrac_cpu_count, idrac_health_ok, idrac_power_capacity_watts, idrac_power_output_watts, and idrac_sensors_temperature to provide a concise overview of performance, reliability, and thermal monitoring across CPUs, memory, and I/O boards. It supports rapid health assessment and trend analysis for proactive maintenance.
Screenshots
Used Metrics 77
idrac_bios_version
idrac_cpu_count
idrac_health_ok
idrac_power_capacity_watts
idrac_power_output_watts
idrac_sensors_tachometer
idrac_sensors_temperature
Get Dashboard✕
Download
Copy to Clipboard