IIS from WMI-Exporter 2,0022,002 1.5 (4 reviews)
5/19/2020
5/19/2020
1
Web Servers
>=7.0.0
Prometheus
Description
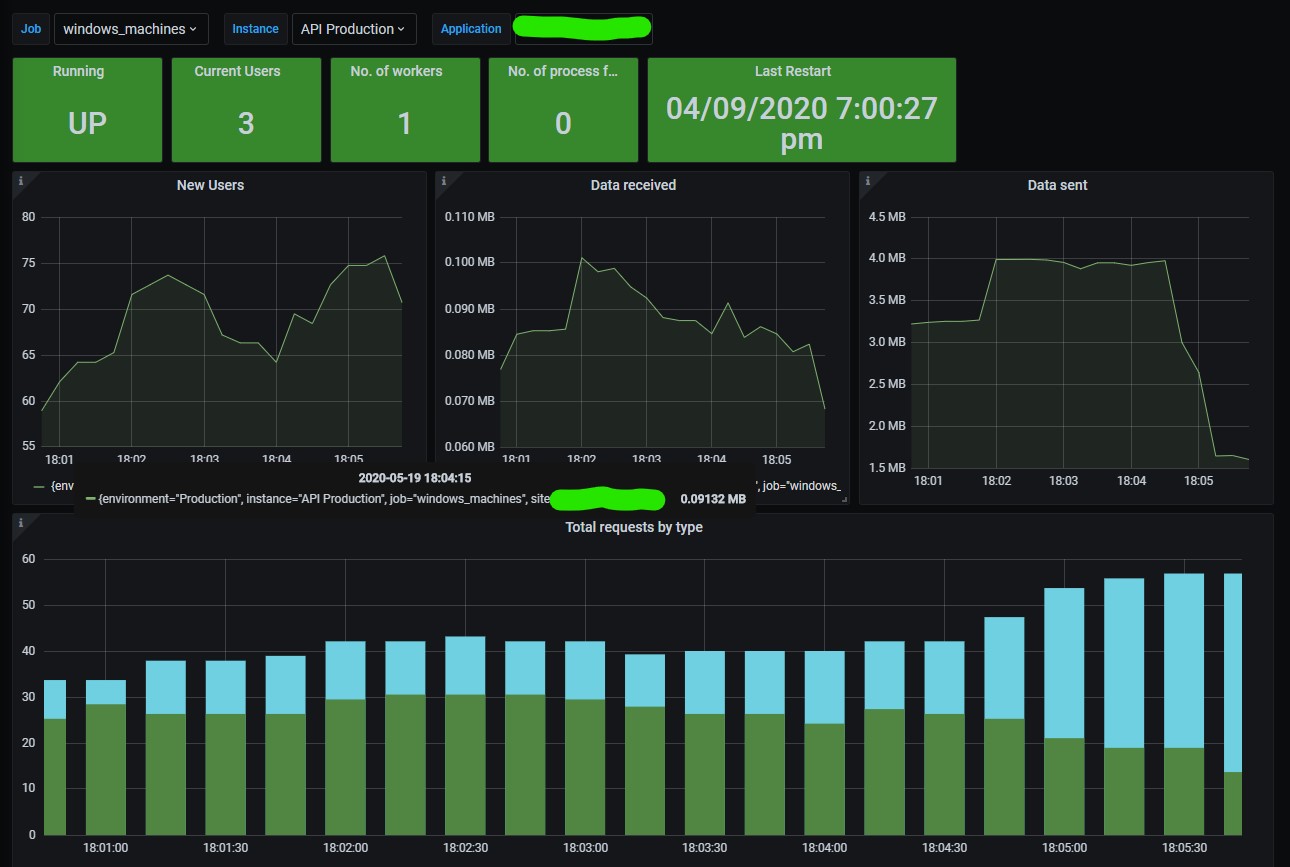
Monitor your IIS server with metrics coming from wmi_exporter.
Screenshots
Used Metrics 99
wmi_iis_anonymous_users_total
wmi_iis_current_application_pool_state
wmi_iis_current_connections
wmi_iis_current_worker_processes
wmi_iis_received_bytes_total
wmi_iis_recent_worker_process_failures
wmi_iis_requests_total
wmi_iis_sent_bytes_total
wmi_iis_total_application_pool_start_time
Get Dashboard✕
Download
Copy to Clipboard