iDRAC SNMP DashBoard 2,6872,687
5/9/2021
5/9/2021
1
Host Metrics
>=7.5.5
Prometheus
Description
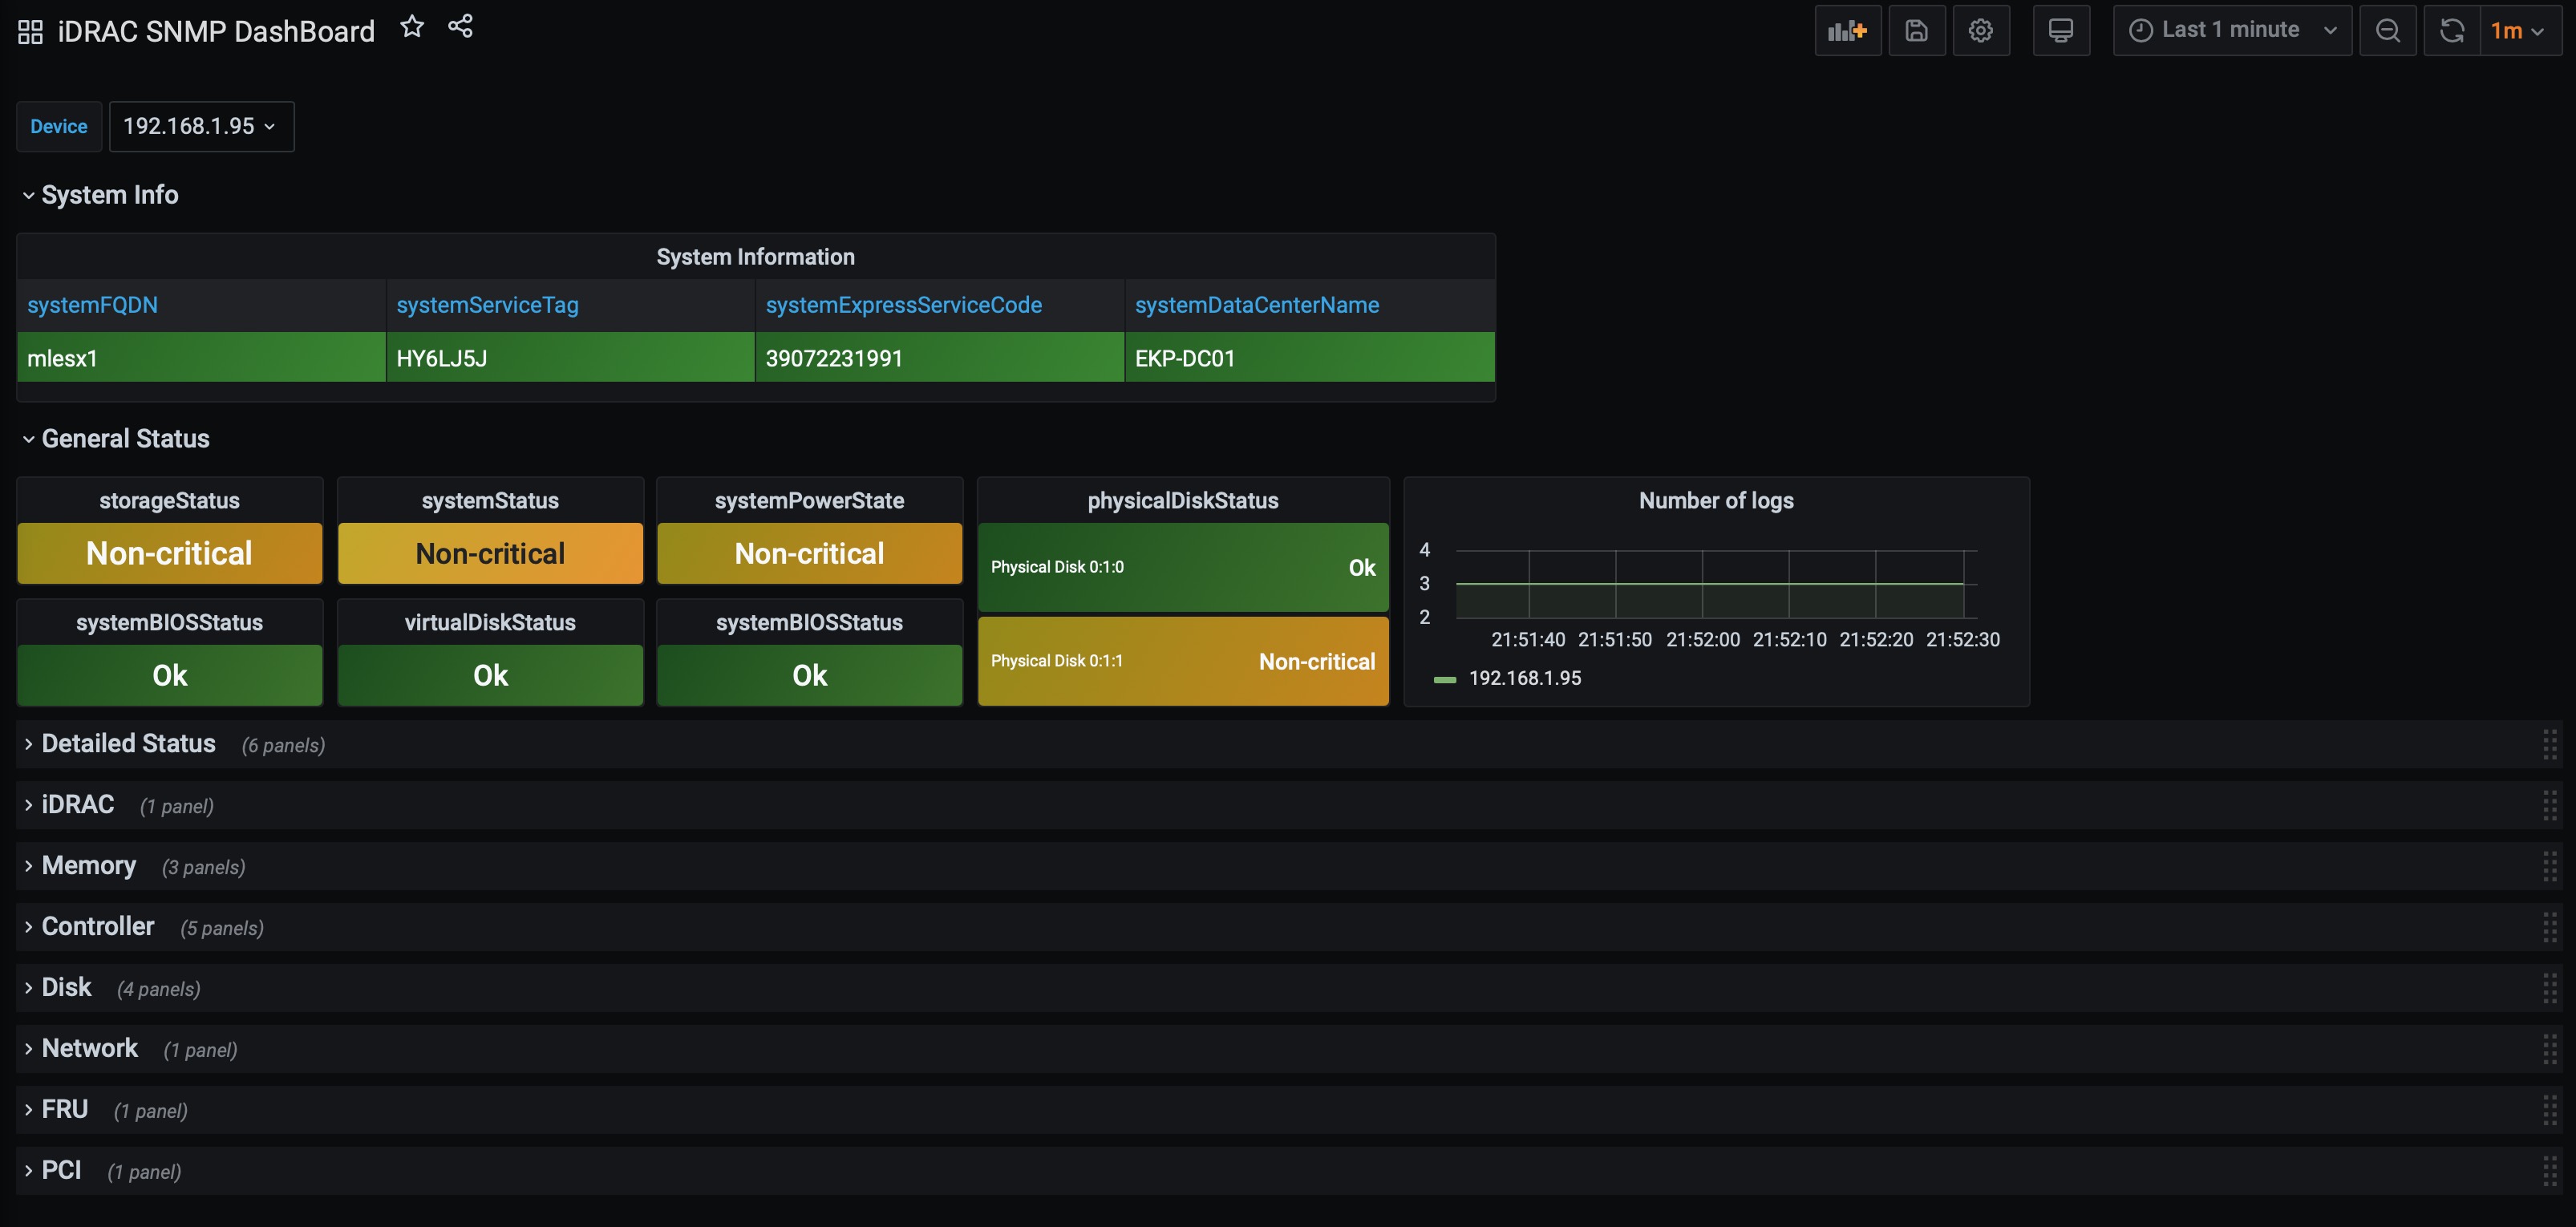
A Dashboard for DELL iDRAC based on SNMP_EXPORTER and Prometheus
Screenshots
Used Metrics 1616
globalStorageStatus
globalSystemStatus
intrusionLocationName
intrusionStatus
numEventLogEntries
physicalDiskComponentStatus
physicalDiskName
systemAssetTag
systemBIOSStatus
systemBIOSVersionName
systemDataCenterName
systemExpressServiceCode
systemFQDN
systemPowerState
systemServiceTag
virtualDiskComponentStatus
Get Dashboard✕
Download
Copy to Clipboard