Hystrix Dashboard 1,8501,850
4/26/2017
4/26/2017
1
>=4.2.0
Prometheus
Description
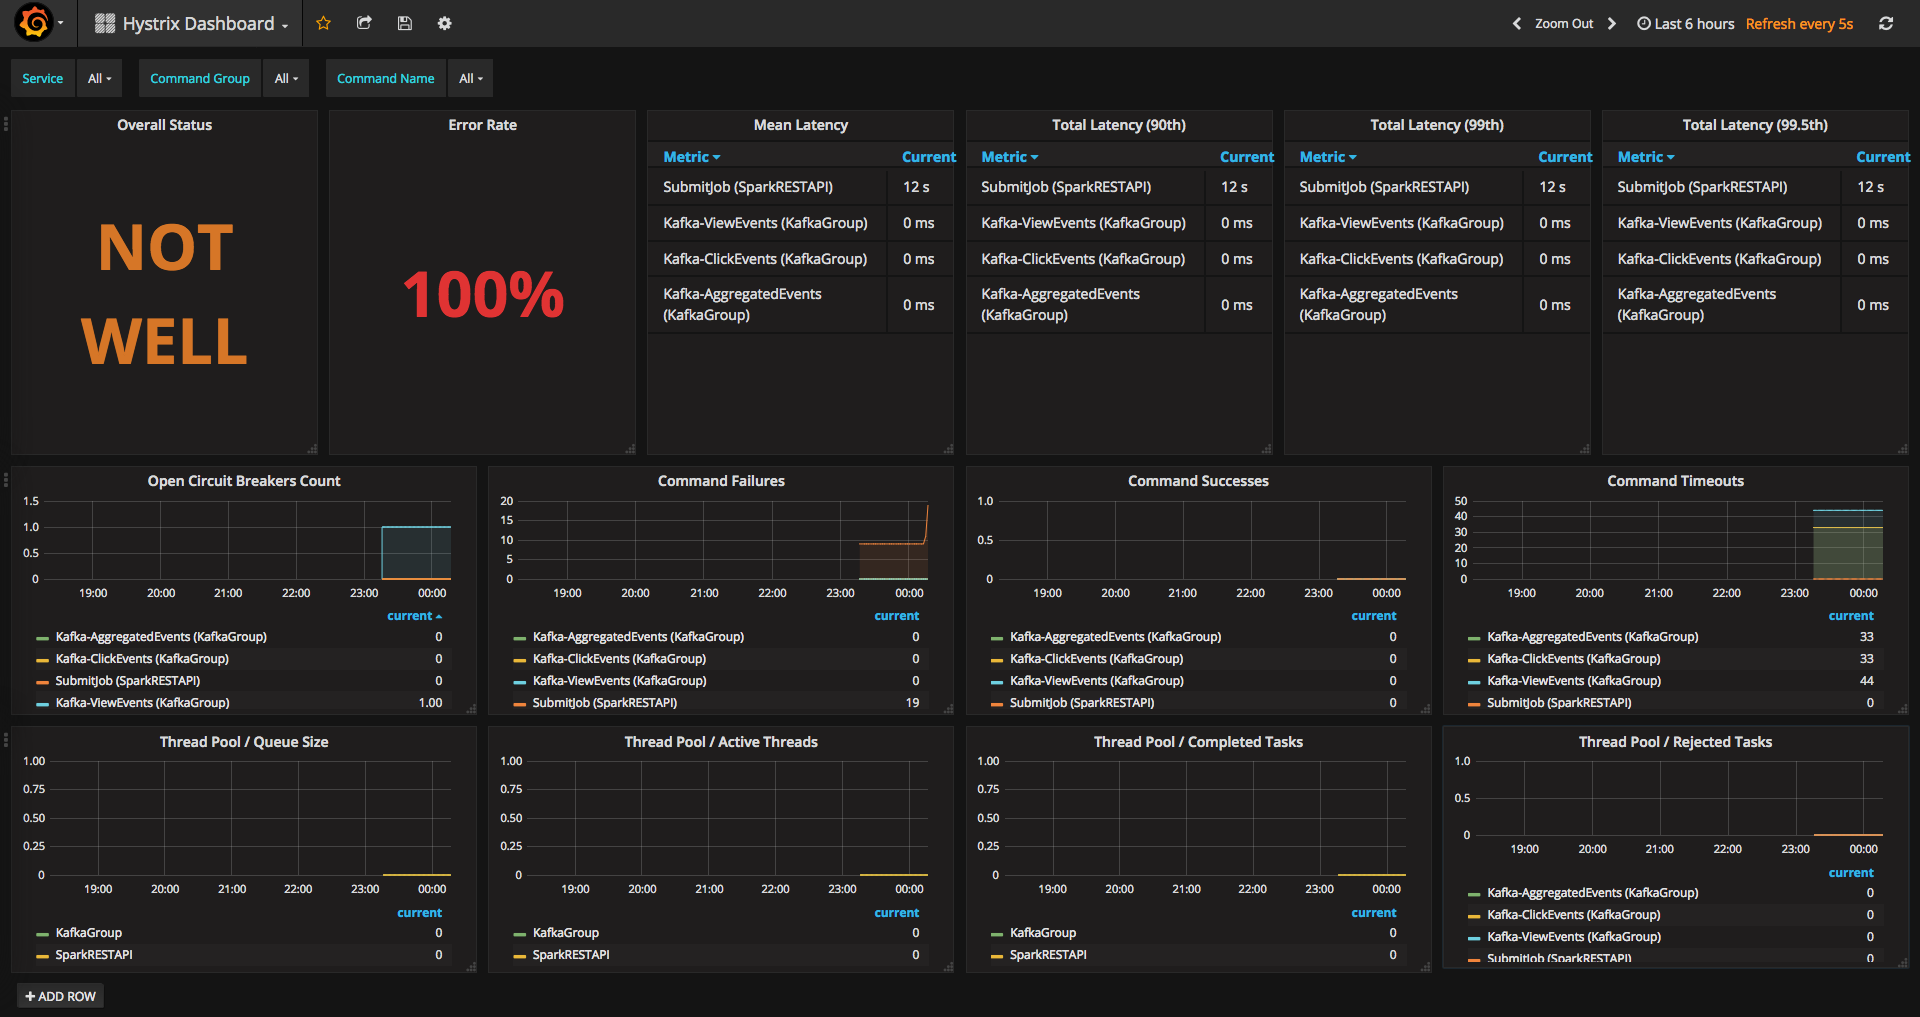
Dashboard to monitor key metrics for Hystrix. The Hystrix metrics are published using Prometheus' simpleclient through this library https://github.com/soundcloud/prometheus-hystrix
Screenshots
Get Dashboard✕
Download
Copy to Clipboard