hwmon 1,2021,202
9/5/2020
9/5/2020
2
Host Metrics
>=7.1.5
Prometheus
Description
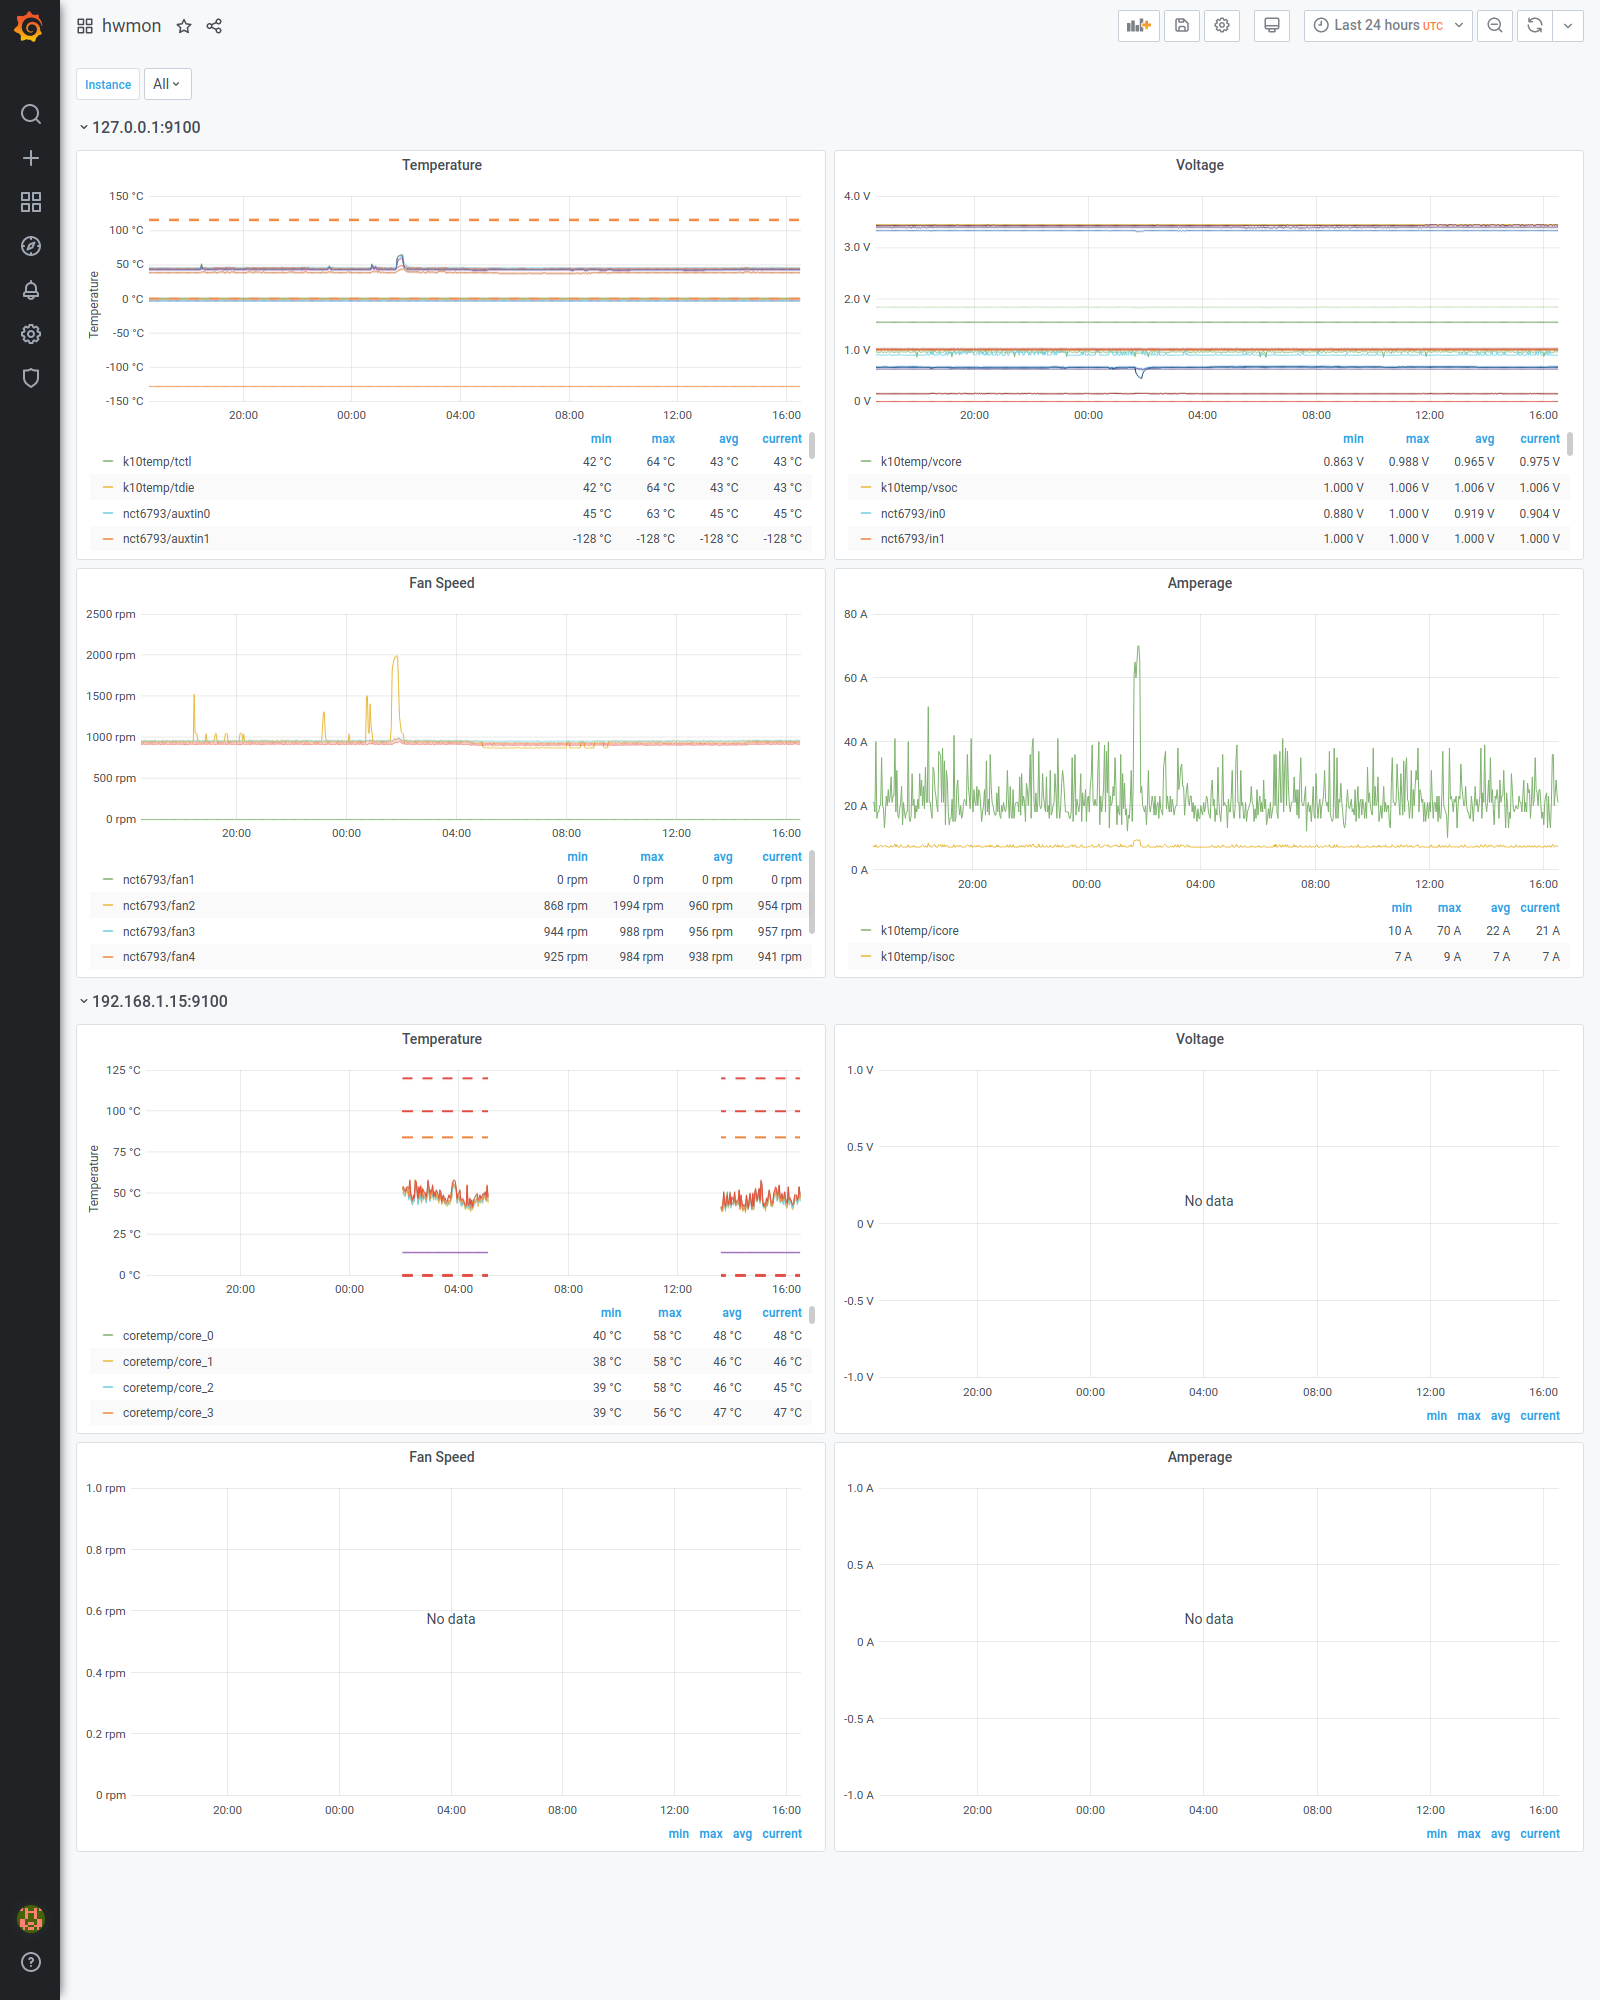
Screenshots
Used Metrics 3939
The
a
as
but
chip
chip_name
display
do
fallback
filter
have
it
label
machine
may
metric
metrics
name
nicest
-
node_hwmon_chip_names
node_hwmon_curr_amps
node_hwmon_fan_rpm
node_hwmon_in_volts
node_hwmon_power_average_watt
node_hwmon_sensor_label
node_hwmon_temp_celsius
node_hwmon_temp_crit_alarm_celsius
node_hwmon_temp_crit_celsius
node_hwmon_temp_crit_hyst_celsius
node_hwmon_temp_max_celsius
not
of
out
possible
sensor
so
that
the
use
Get Dashboard✕
Download
Copy to Clipboard