HPE Storage Array Details 1,2421,242
8/23/2021
8/31/2021
3
Host Metrics
>=8.0.5
Prometheus
Description
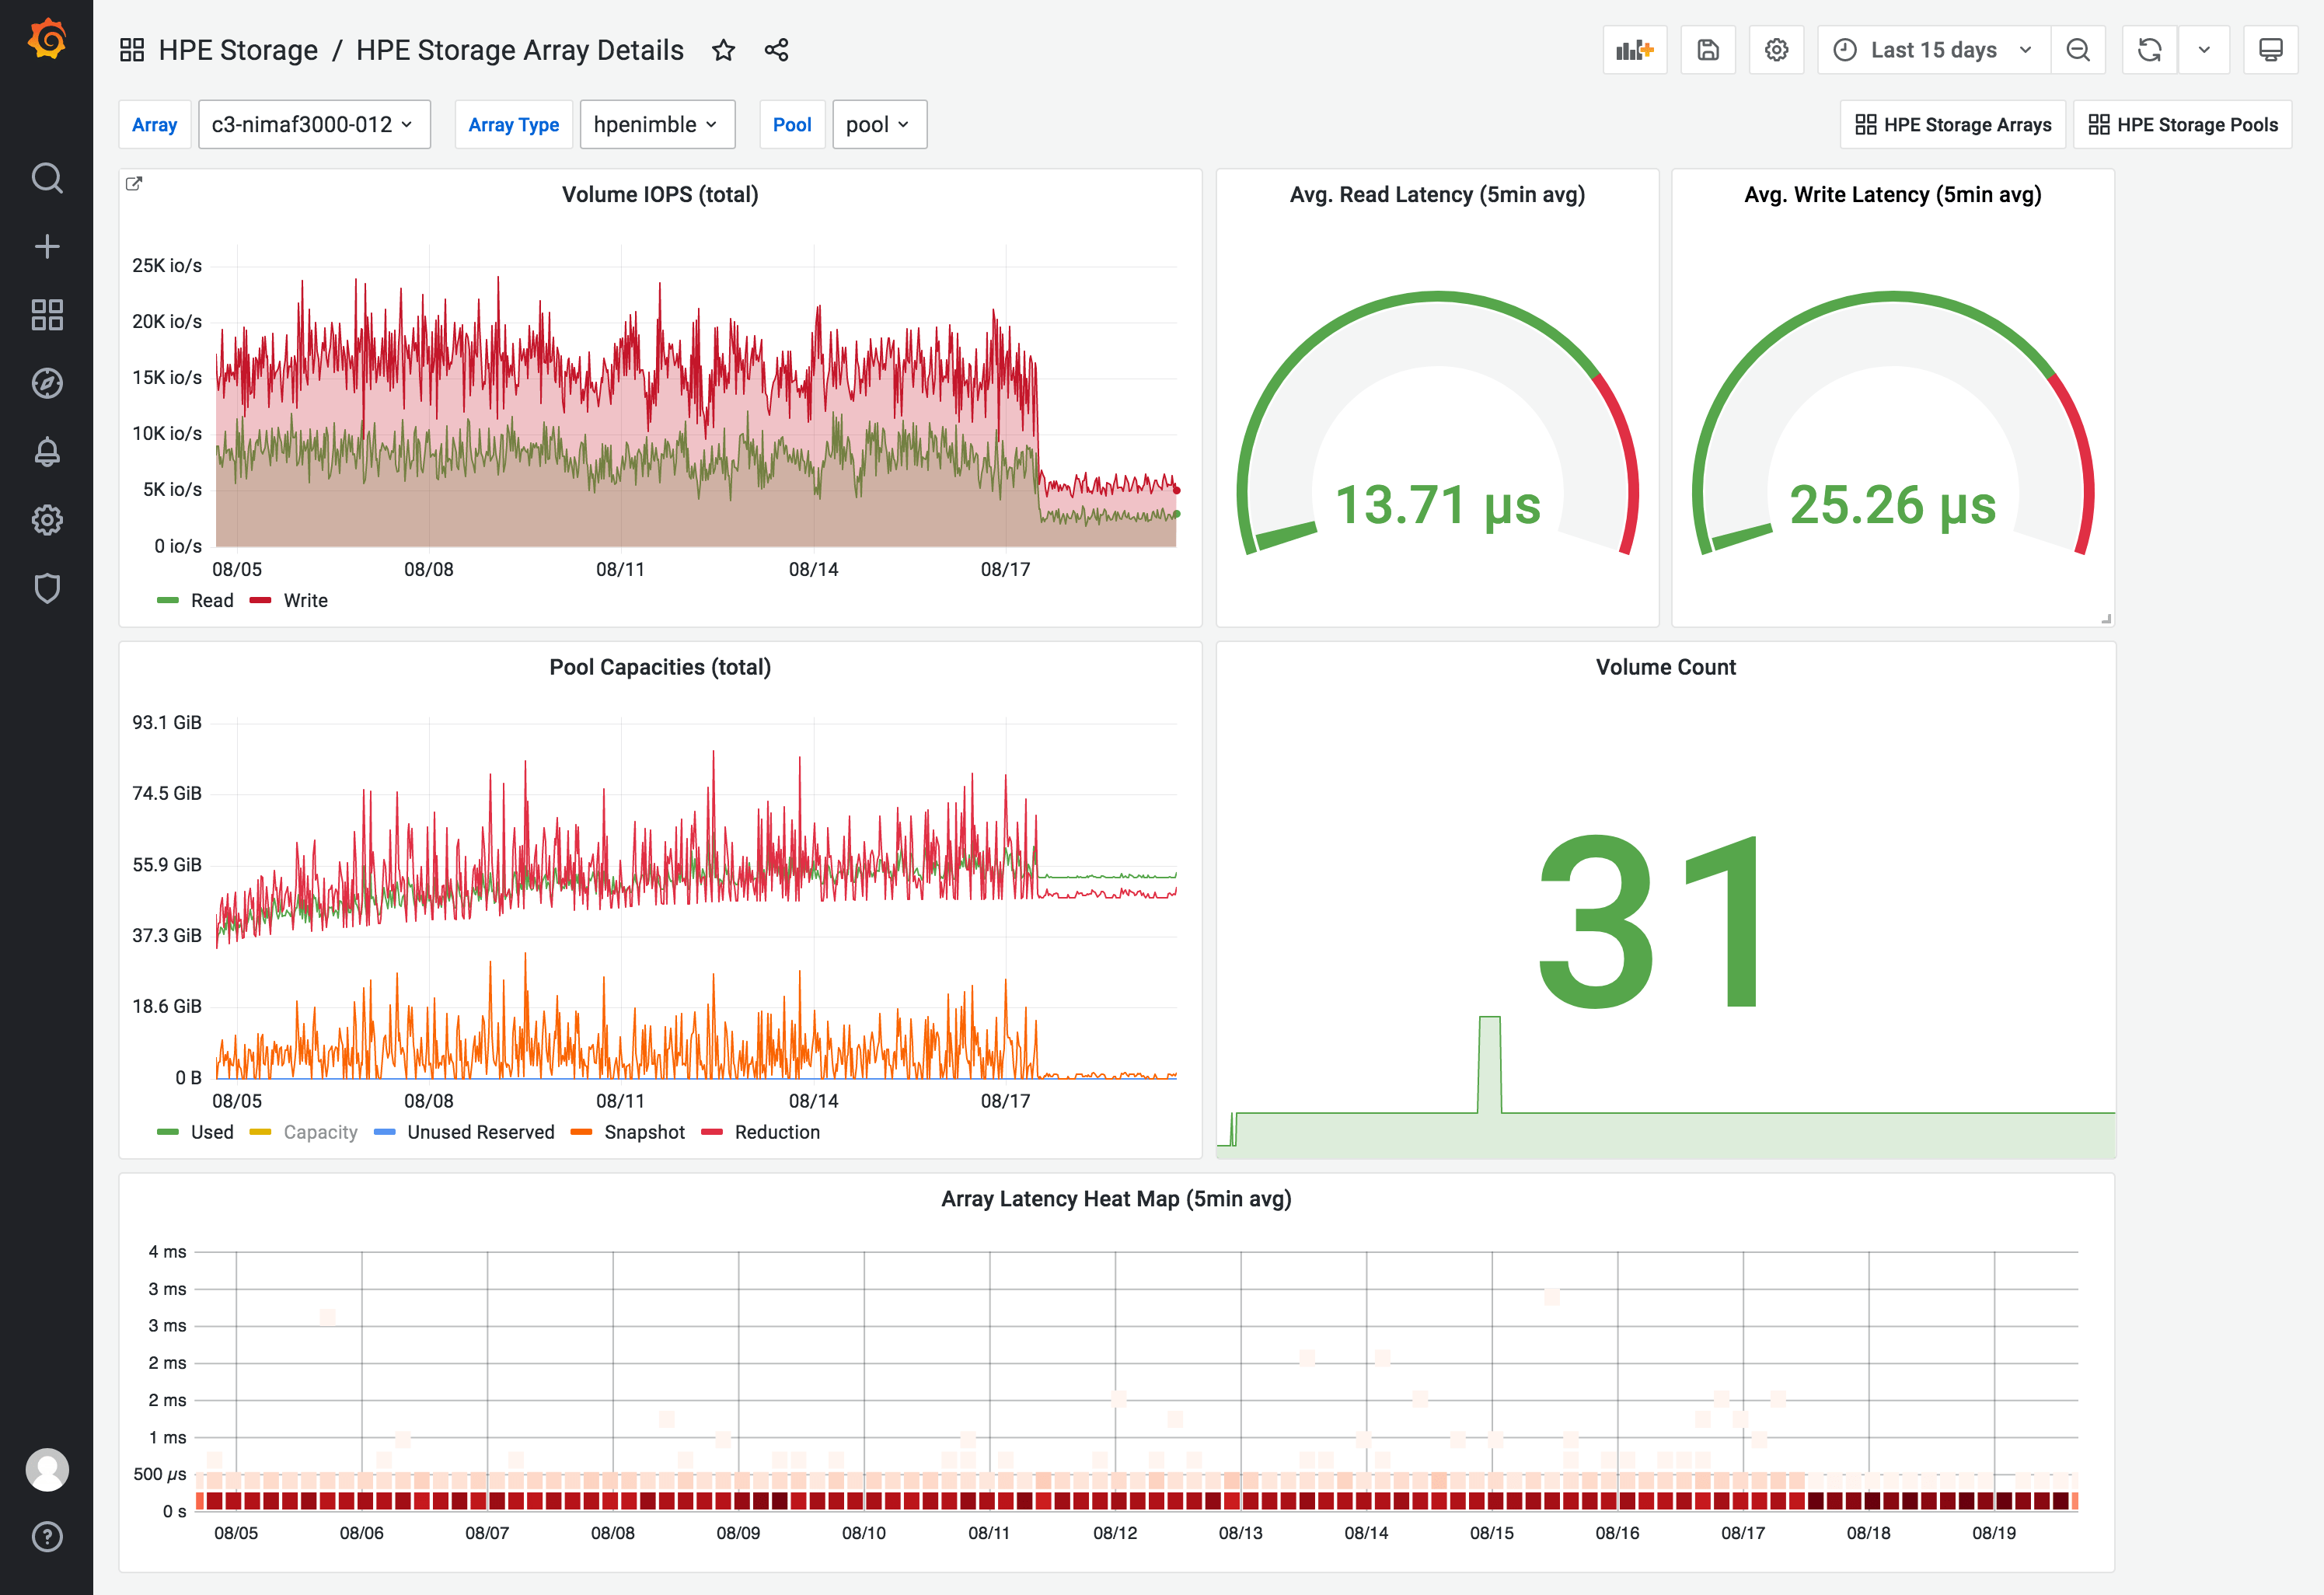
Provides a birds eye view of a HPE storage array.
Screenshots
Used Metrics 1010
hpe_storagepool_capacity_bytes
hpe_storagepool_data_reduction_bytes
hpe_storagepool_snapshot_used_bytes
hpe_storagepool_unused_reserve_bytes
hpe_storagepool_volume_used_bytes
hpe_volume_reads_per_second_avg
hpe_volume_seconds_per_read_avg
hpe_volume_seconds_per_write_avg
hpe_volume_size_bytes
hpe_volume_writes_per_second_avg
Get Dashboard✕
Download
Copy to Clipboard