HPE OneView Metrics 781781 4.5 (2 reviews)
5/20/2019
7/3/2019
1
Host Metrics
>=6.0.0
Prometheus
Description
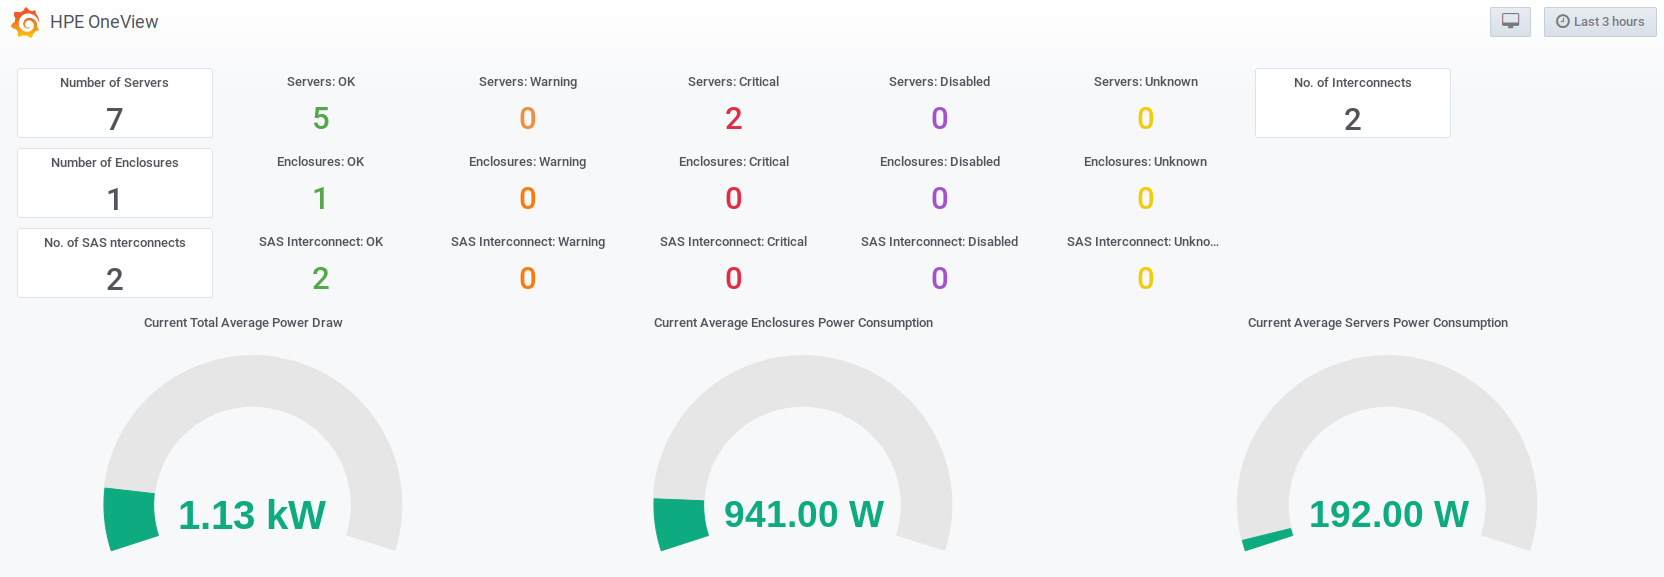
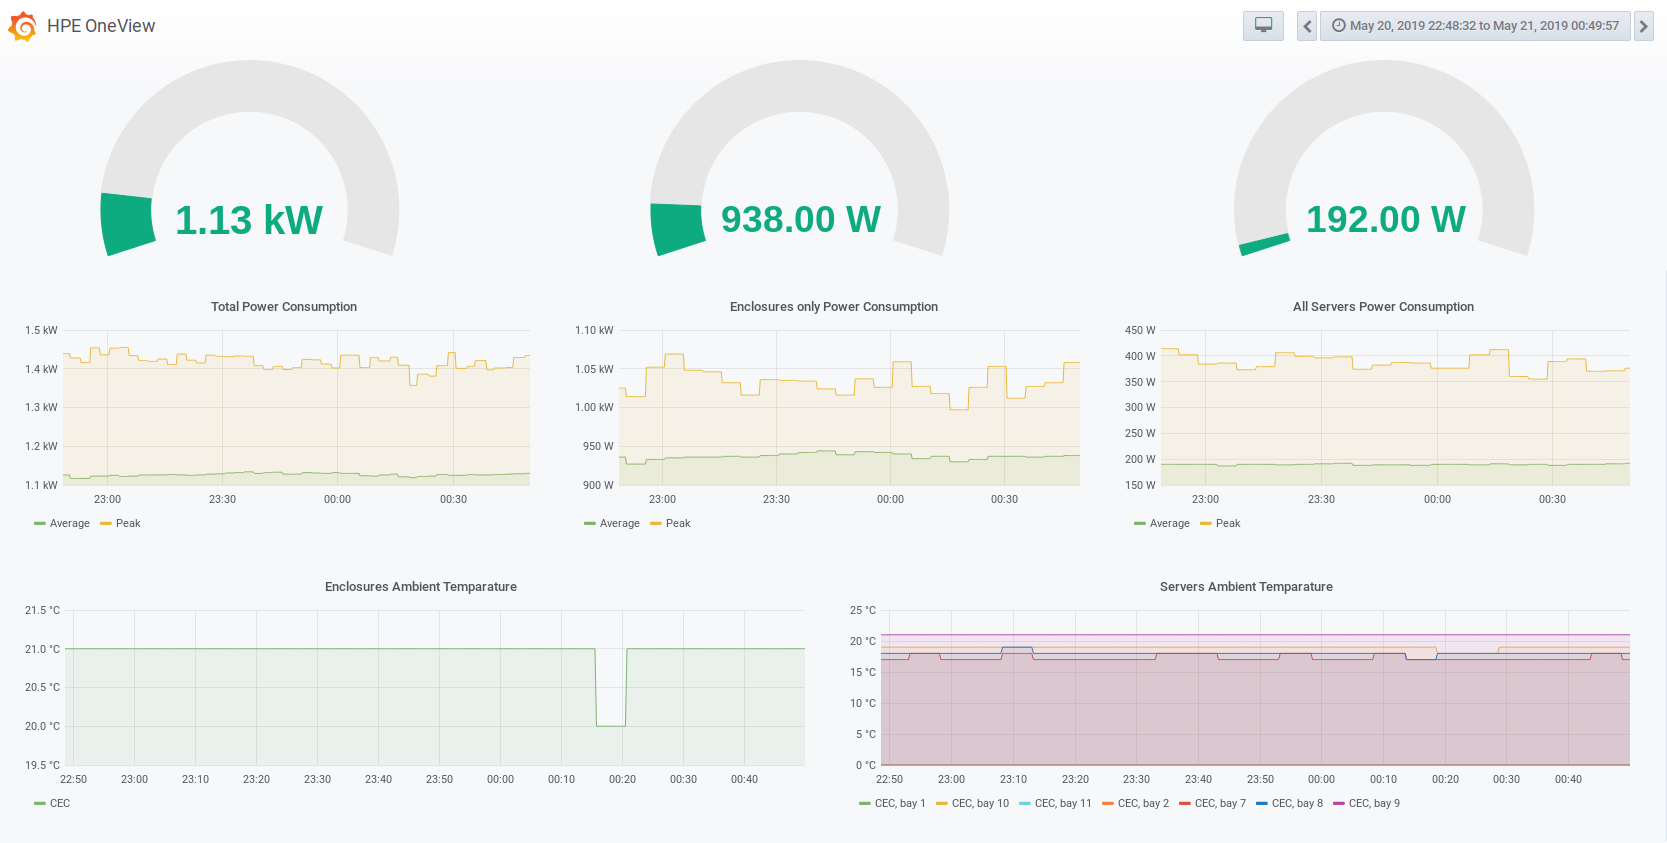
Monitor your physical infrastructure managed by HPE OneView (HPE Synergy) for servers' CPU utilization, ambient temperature and all infrastructure power consumption as well as components state.
Screenshots
Used Metrics 55
oneview_ambientTemperature_celcius
oneview_averagePower_watts
oneview_count
oneview_peakPower_watts
oneview_status
Get Dashboard✕
Download
Copy to Clipboard