Horizontal Pod Autoscaler (HPA) 3,493,2993,493,299
Description
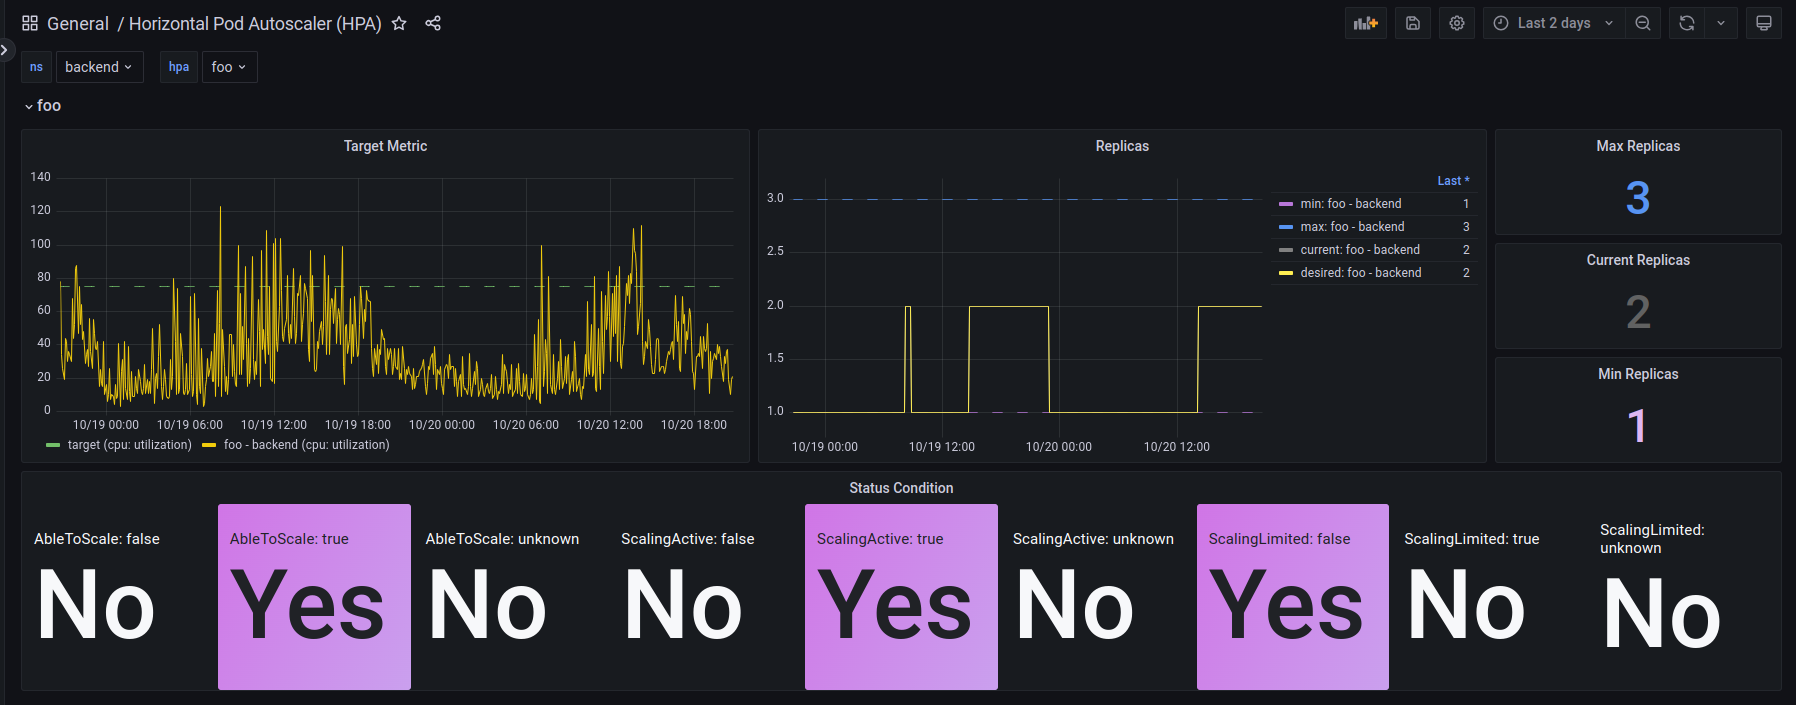
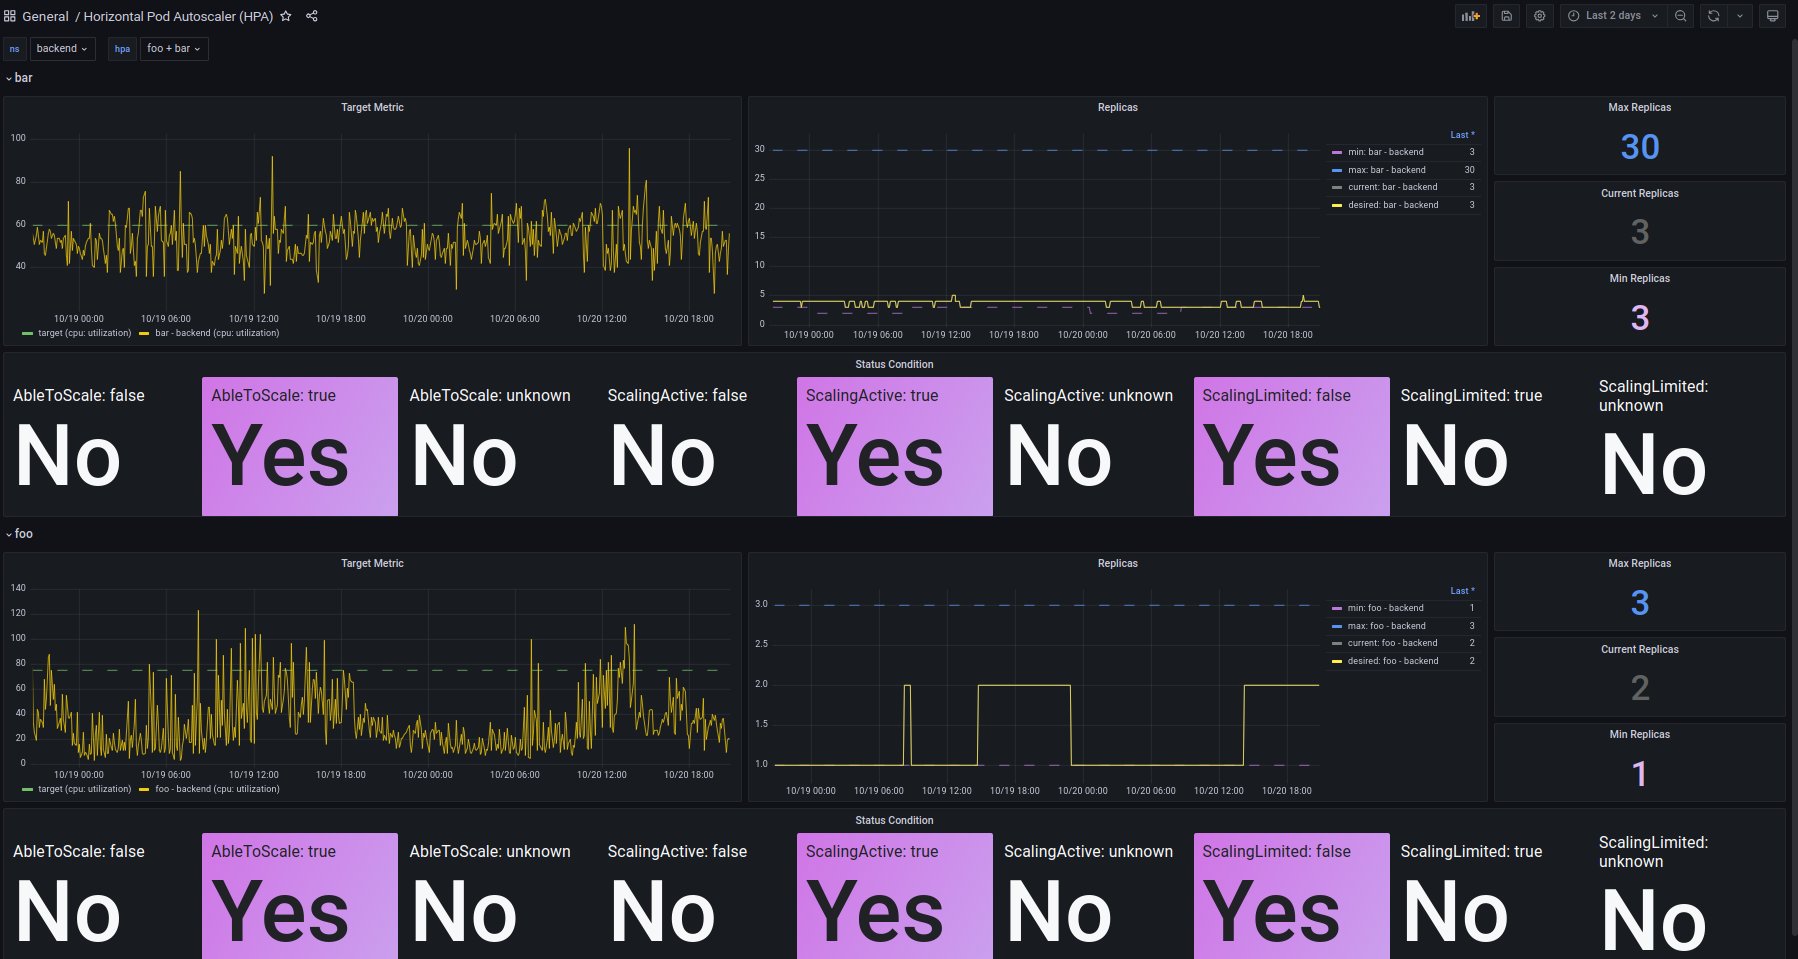
Monitors Kubernetes Horizontal Pod Autoscaler health and scaling activity by visualizing core HPA metrics. Key metrics include kube_horizontalpodautoscaler_spec_target_metric (desired target metric), kube_horizontalpodautoscaler_status_desired_replicas (planned replicas) and kube_horizontalpodautoscaler_status_current_replicas with the min/max replicas bounds (kube_horizontalpodautoscaler_spec_min_replicas, kube_horizontalpodautoscaler_spec_max_replicas). The dashboard highlights status condition and replica counts to quickly assess scaling behavior, stability, and whether autoscaling meets the configured thresholds.
Screenshots
Used Metrics 77
kube_horizontalpodautoscaler_spec_max_replicas
kube_horizontalpodautoscaler_spec_min_replicas
kube_horizontalpodautoscaler_spec_target_metric
kube_horizontalpodautoscaler_status_condition
kube_horizontalpodautoscaler_status_current_replicas
kube_horizontalpodautoscaler_status_desired_replicas
kube_horizontalpodautoscaler_status_target_metric