Home Energy Usage v2 7,1117,111 3.0 (1 reviews)
2/23/2021
10/4/2021
3
>=8.1.5
Prometheus
Description
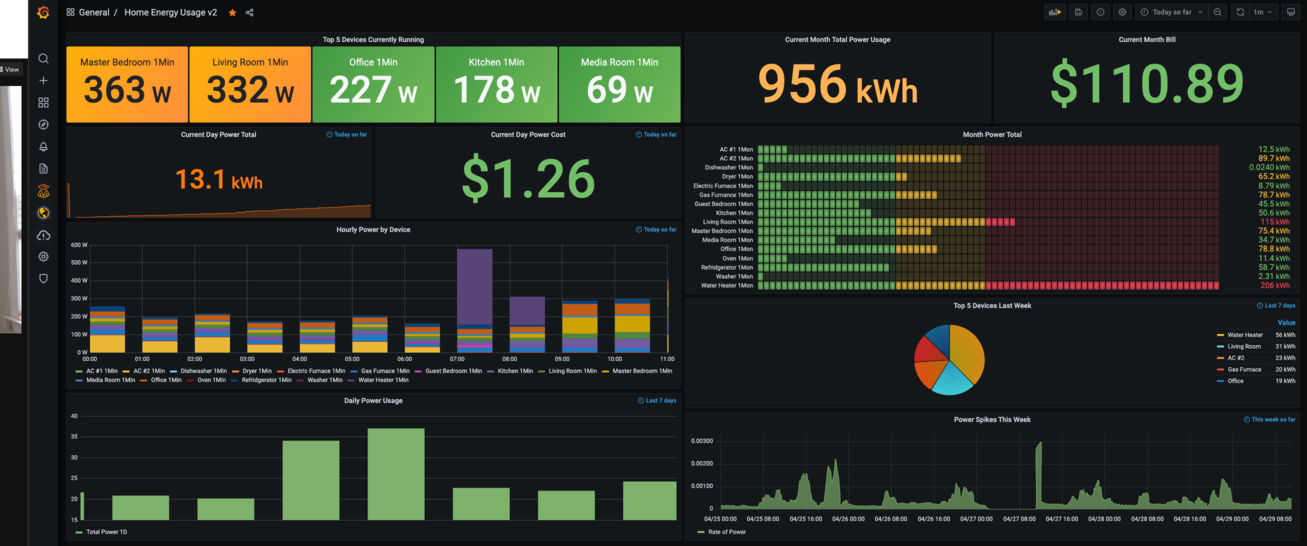
A dashboard that shows your home energy usage. Using Prometheus, Home Assistant and the Emporia Vue 2.
Screenshots
Used Metrics 33
homeassistant_sensor_energy_kwh
homeassistant_sensor_power_w
topk
Get Dashboard✕
Download
Copy to Clipboard