High level Sloth SLOs 334,909334,909
6/30/2021
6/30/2021
2
>=8.0.2
Prometheus
Description
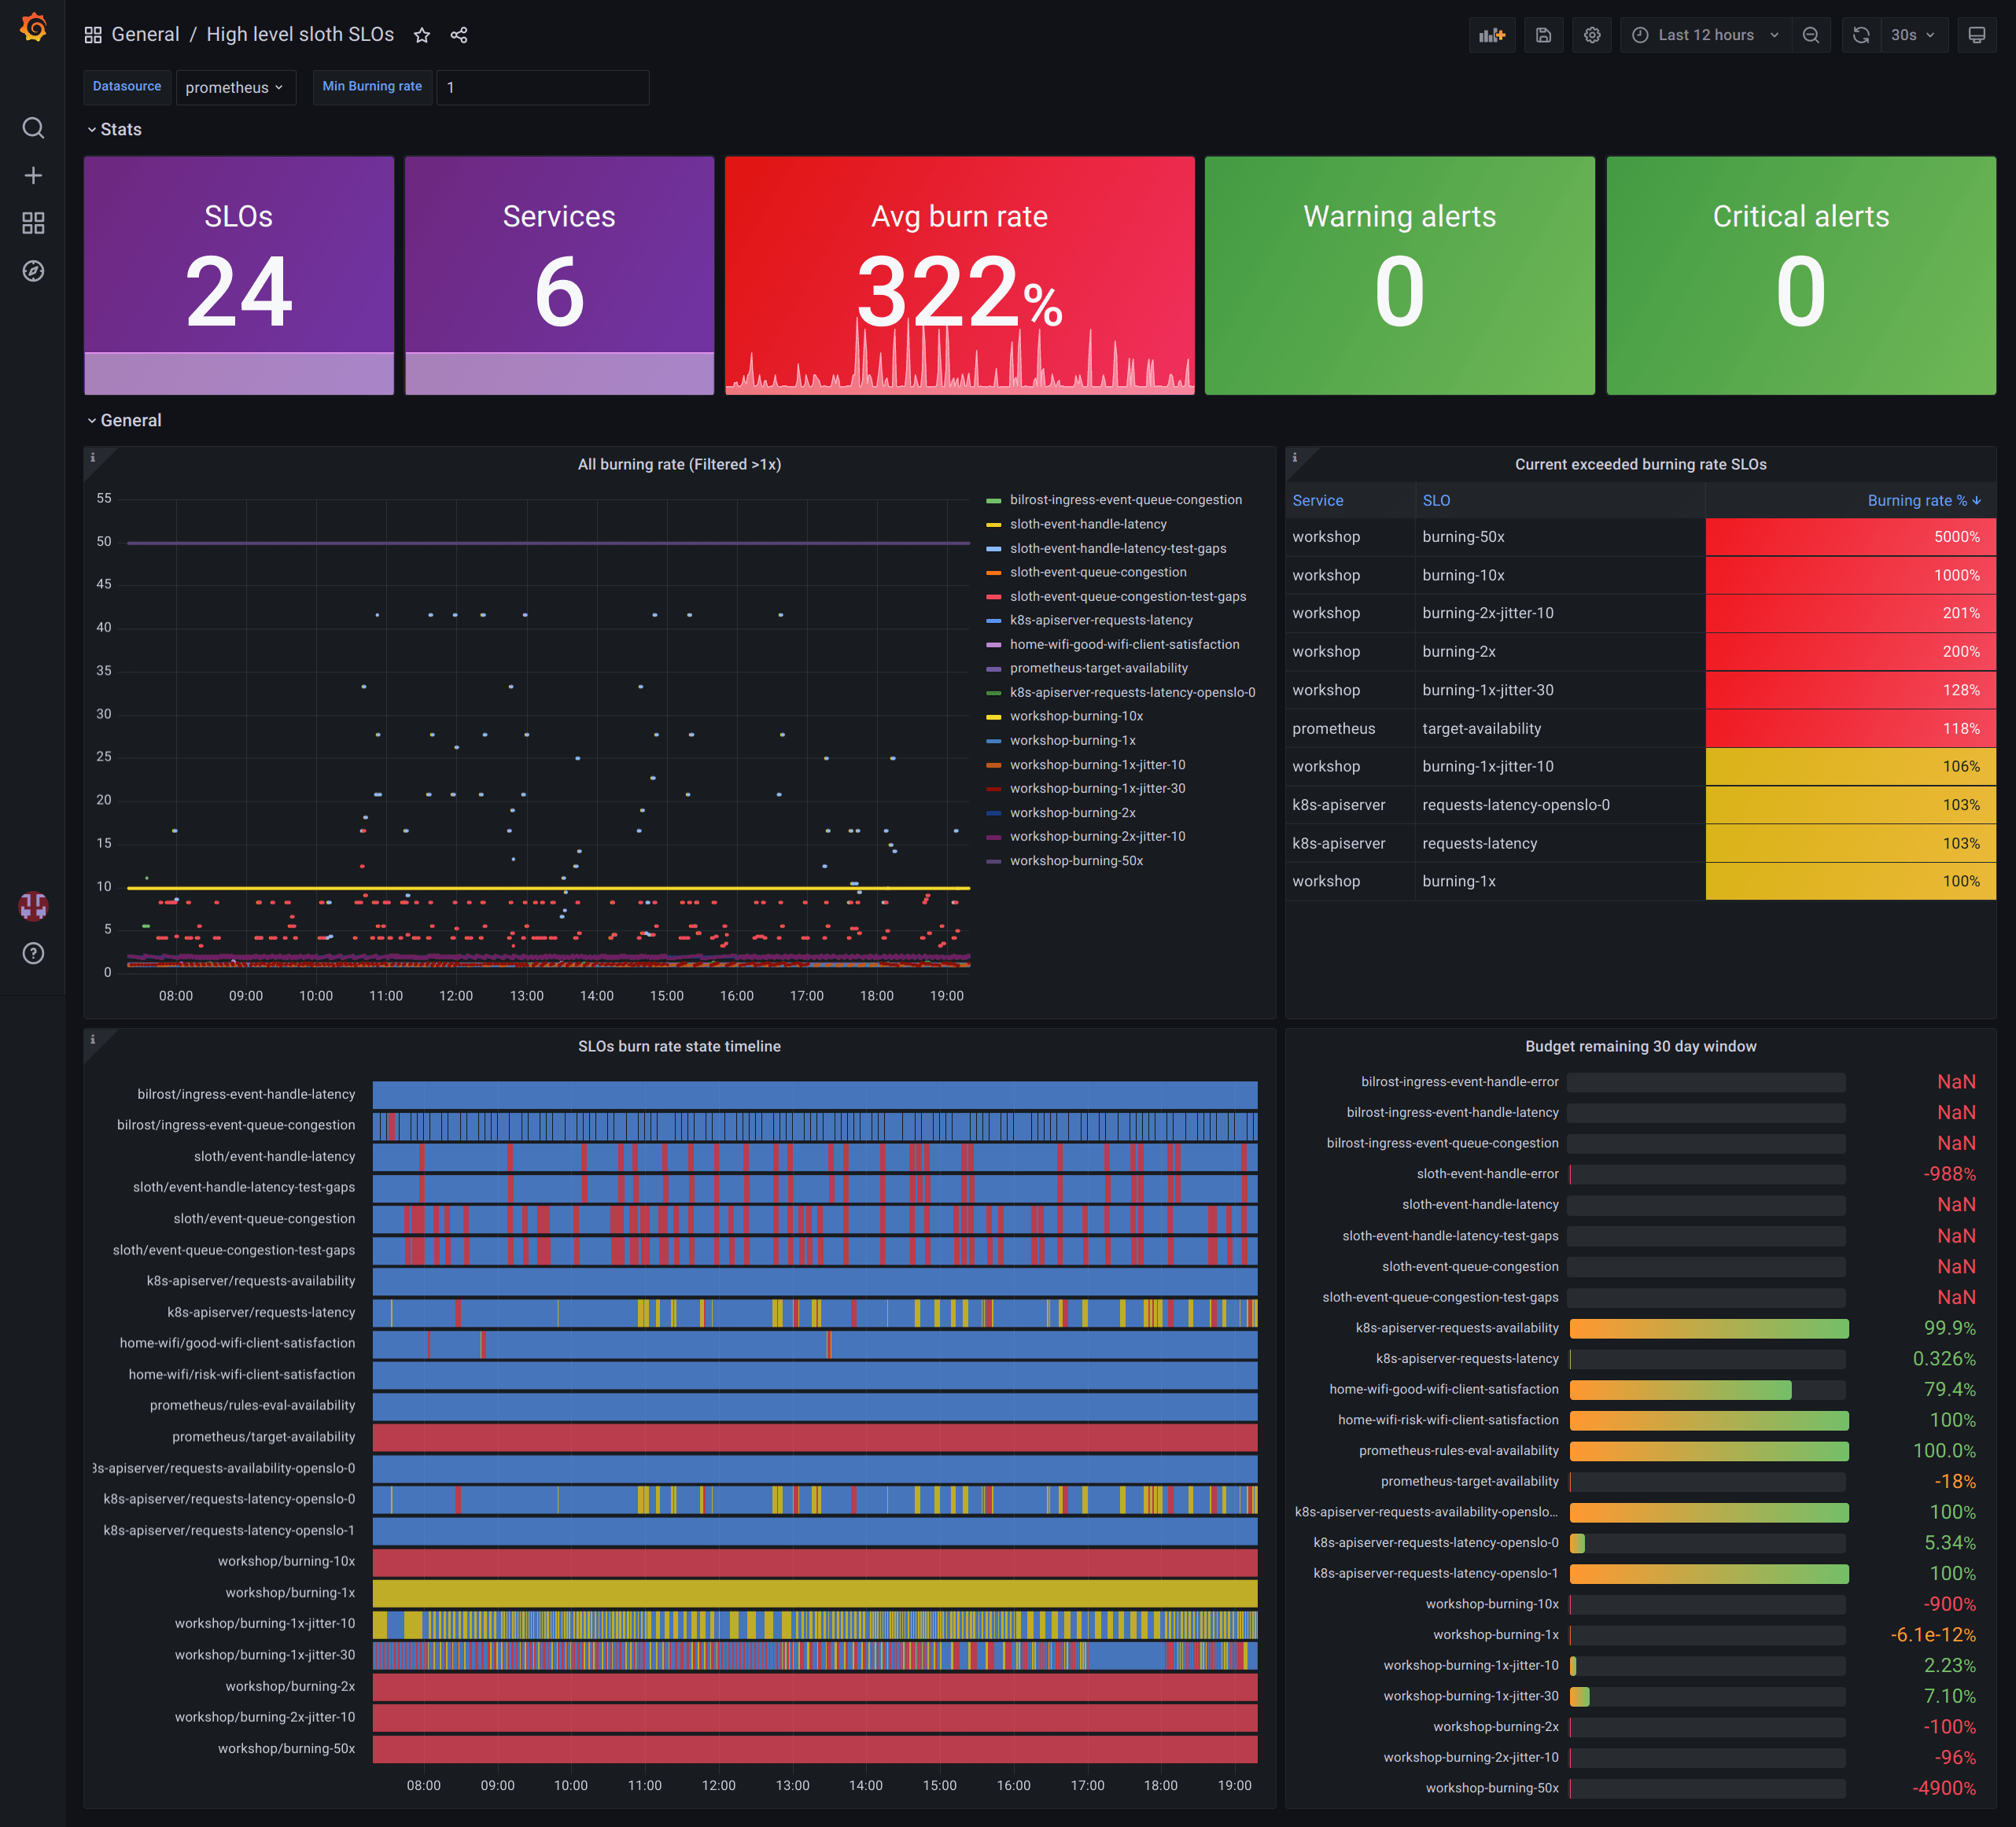
This dashboard monitors high-level SLO health and burn metrics, providing a concise view of whether service level objectives are being met and how quickly burn rates are accumulating. Key visuals focus on the current burn rate relative to targets, the status of SLOs that have exceeded thresholds, and the remaining error budget over a 30-day window, with timeline trends and filtered burn rate spikes to quickly identify risk. Highlights include sloth_slo_info, slo:current_burn_rate:ratio, and slo:period_error_budget_remaining:ratio to quantify status and budget health at a glance.
Screenshots
Used Metrics 44
ALERTS
slo:current_burn_rate:ratio
slo:period_error_budget_remaining:ratio
sloth_slo_info
Get Dashboard✕
Download
Copy to Clipboard