HCP Vault 2,1922,192
10/18/2021
10/25/2021
2
>=8.2.1-37459
Prometheus
Description
Hashicorp Vault Metrics
Screenshots
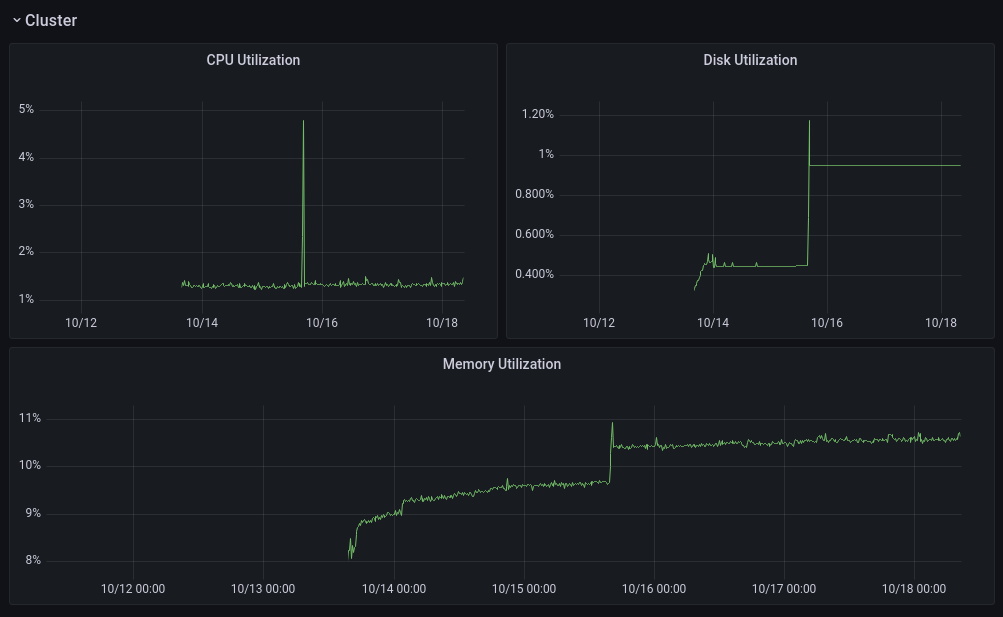
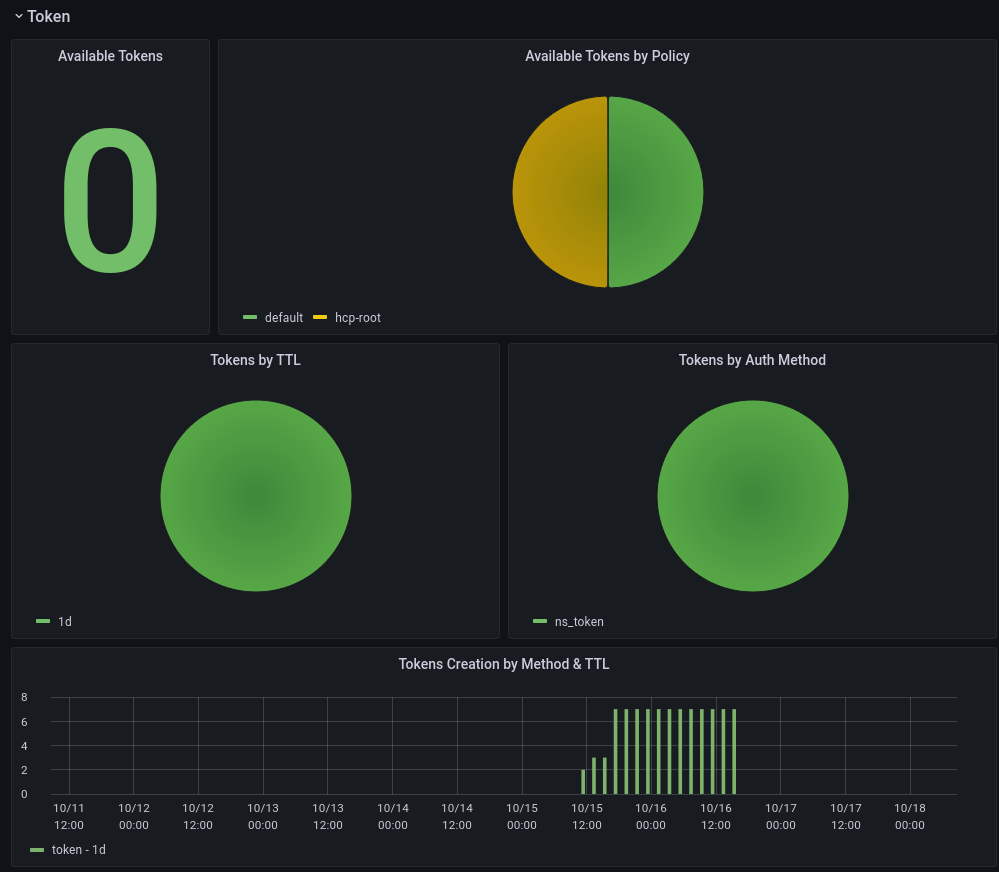
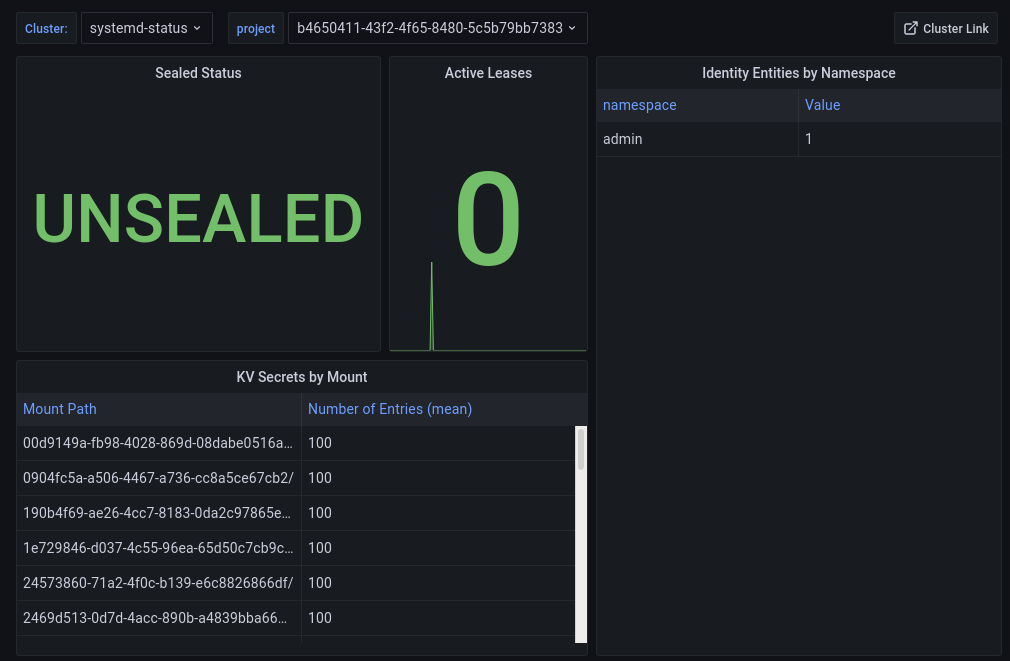
Used Metrics 1818
host_cpu_seconds_total
host_filesystem_free_bytes
host_filesystem_total_bytes
host_memory_available_bytes
host_memory_total_bytes
vault_core_handle_login_request
vault_core_unsealed
vault_expire_num_leases
vault_expire_renew
vault_expire_revoke
vault_identity_entity_count
vault_secret_kv_count
vault_token_count
vault_token_count_by_auth
vault_token_count_by_policy
vault_token_count_by_ttl
vault_token_creation
vault_token_lookup_count
Get Dashboard✕
Download
Copy to Clipboard