HBase 2.x 1,6381,638
5/6/2020
9/20/2020
2
>=6.4.2
Prometheus
Description
Hbase 2.x in kubernetes using prometheus jmx eporter
Screenshots
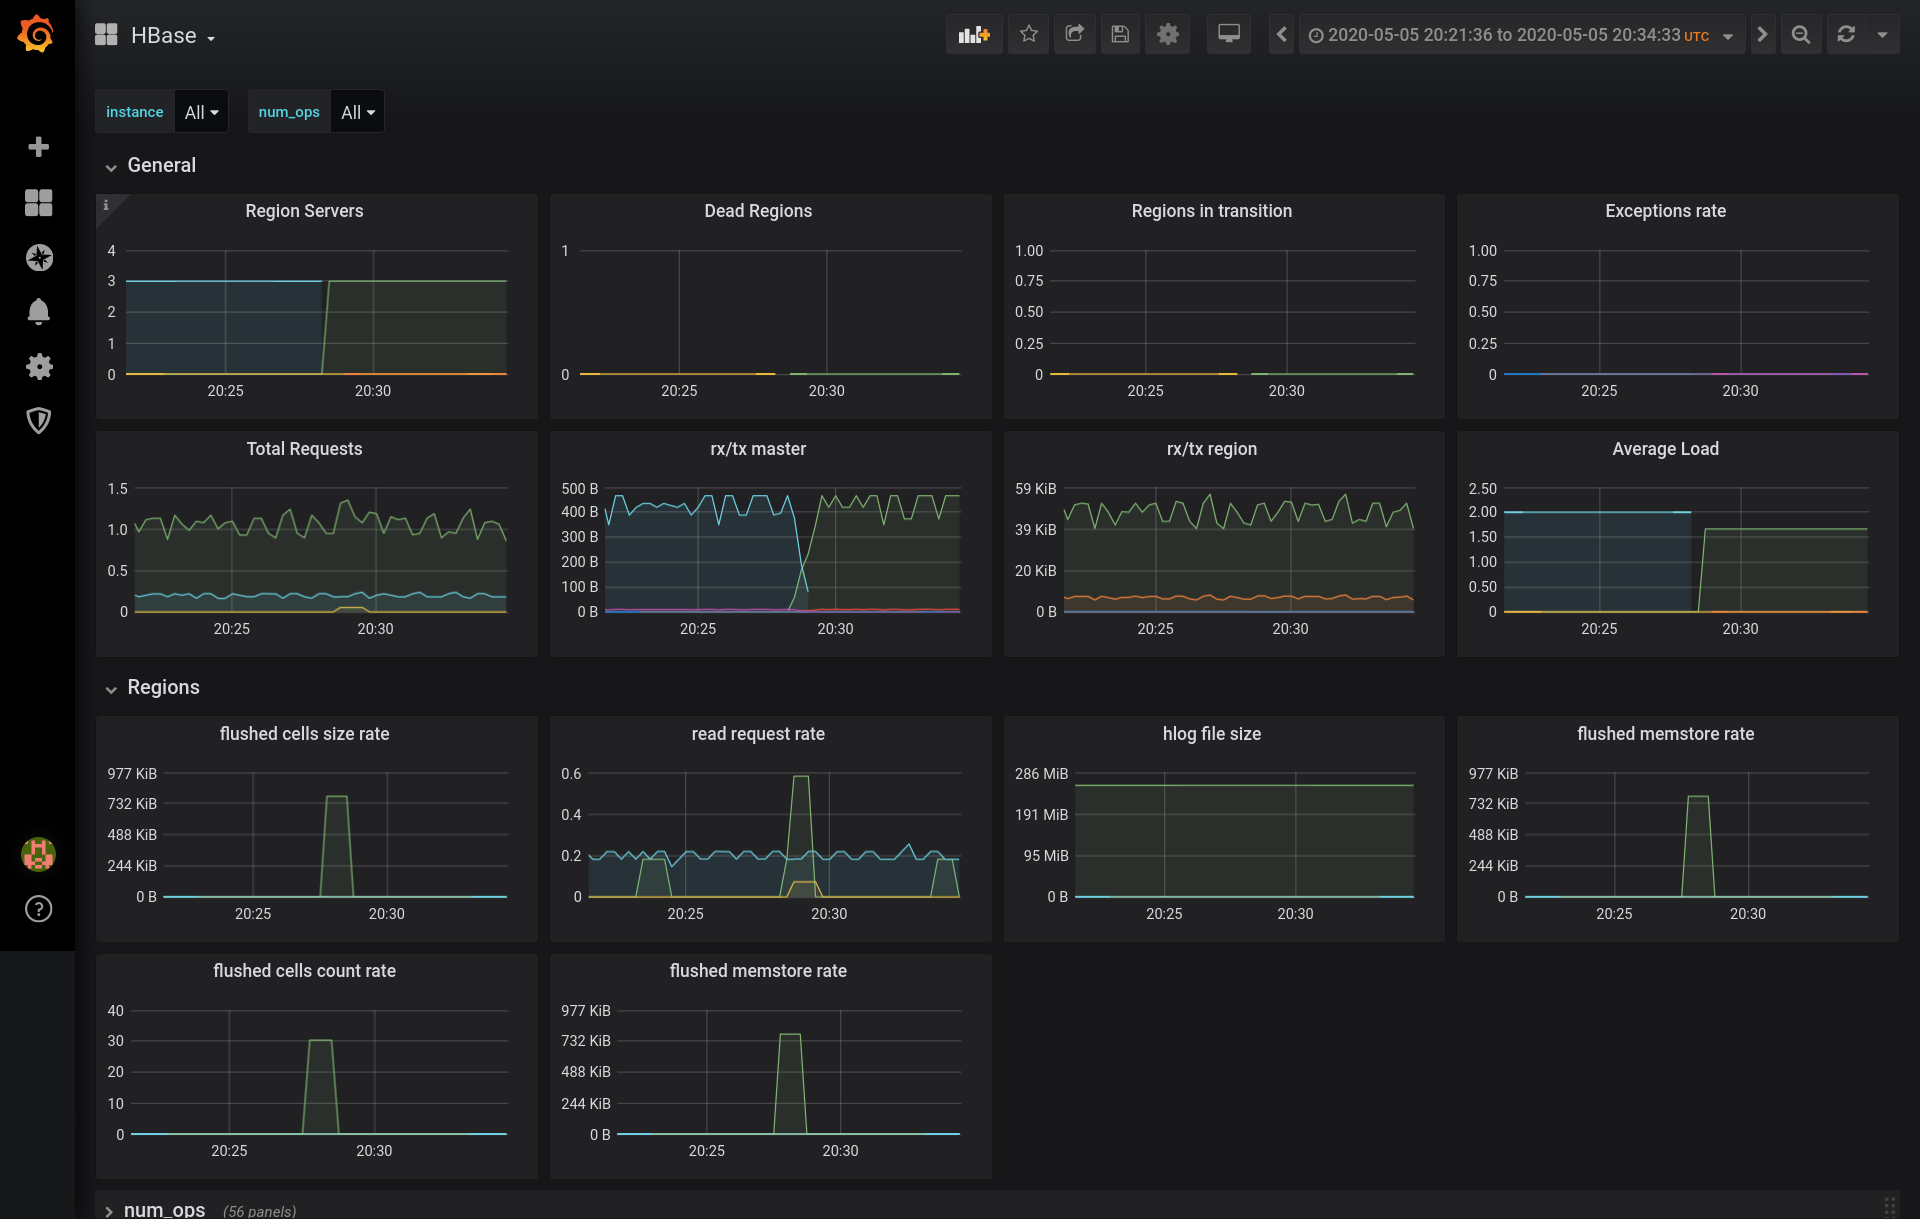
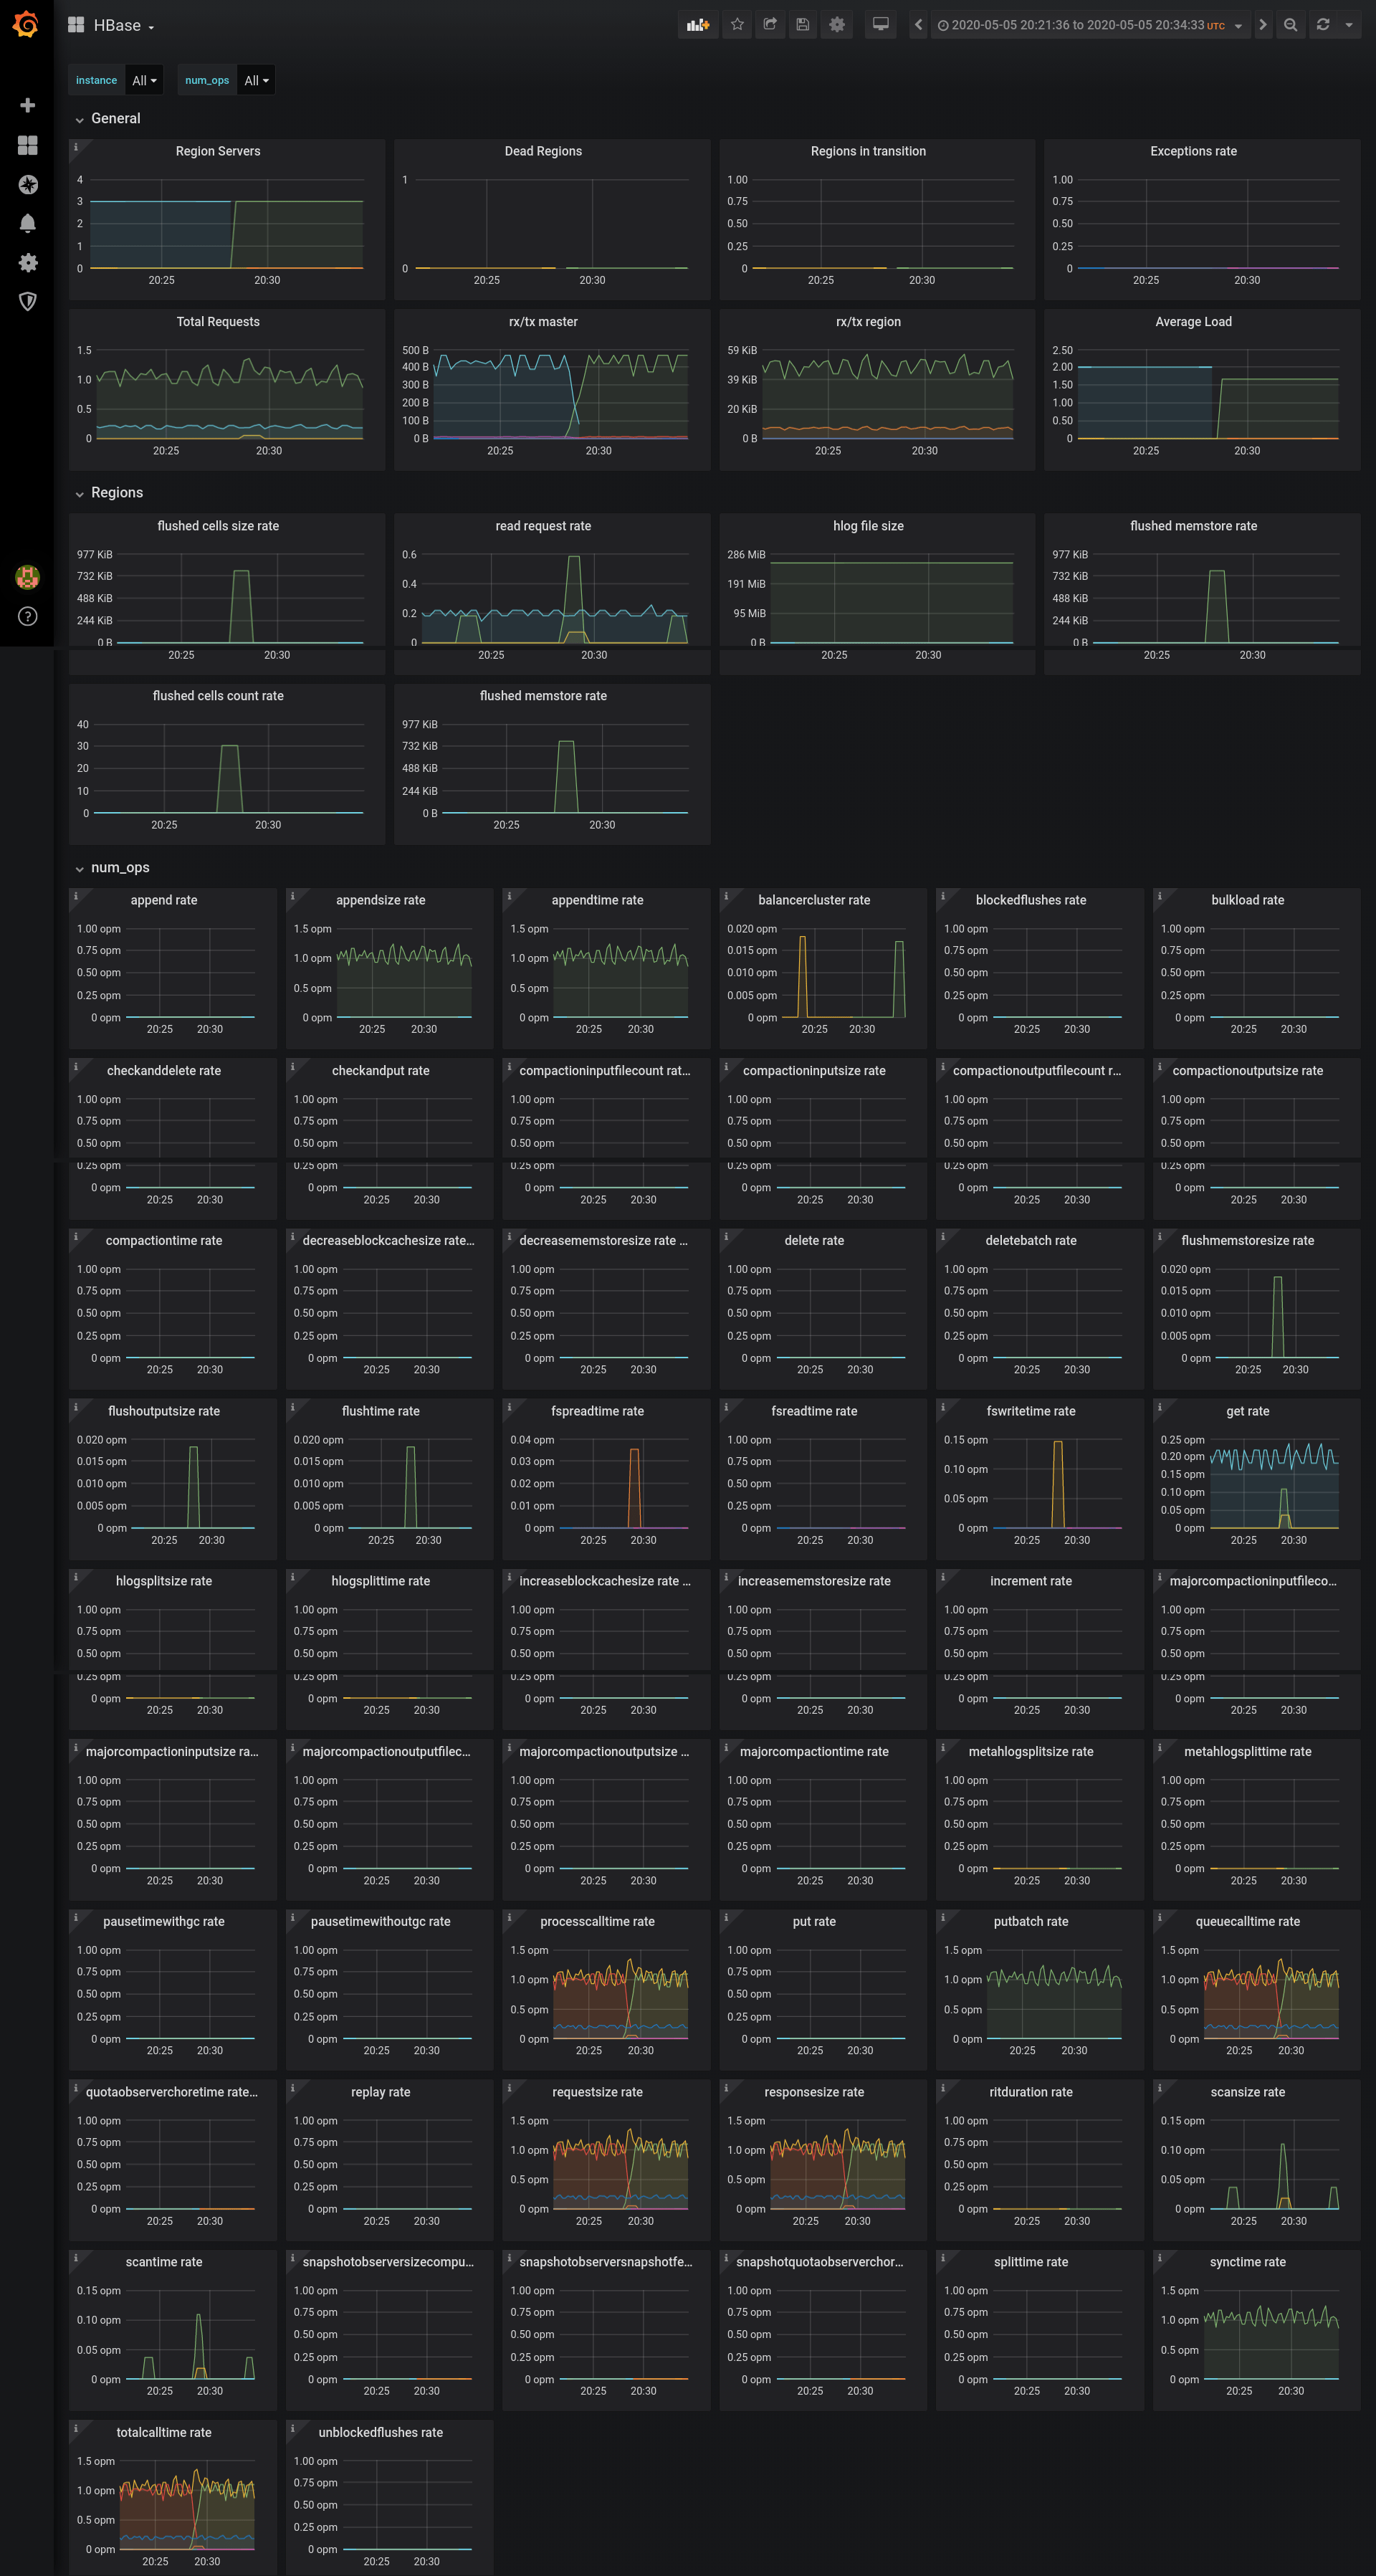
Used Metrics 88
hadoop_hbase_averageload
hadoop_hbase_deadserveropenregions
hadoop_hbase_exceptions
hadoop_hbase_numregionservers
hadoop_hbase_receivedbytes
hadoop_hbase_ritcount
hadoop_hbase_sentbytes
hadoop_hbase_totalrequestcount
Get Dashboard✕
Download
Copy to Clipboard