Hazelcast Default 4,3914,391
10/15/2020
10/15/2020
1
>=6.7.3
Prometheus
Description
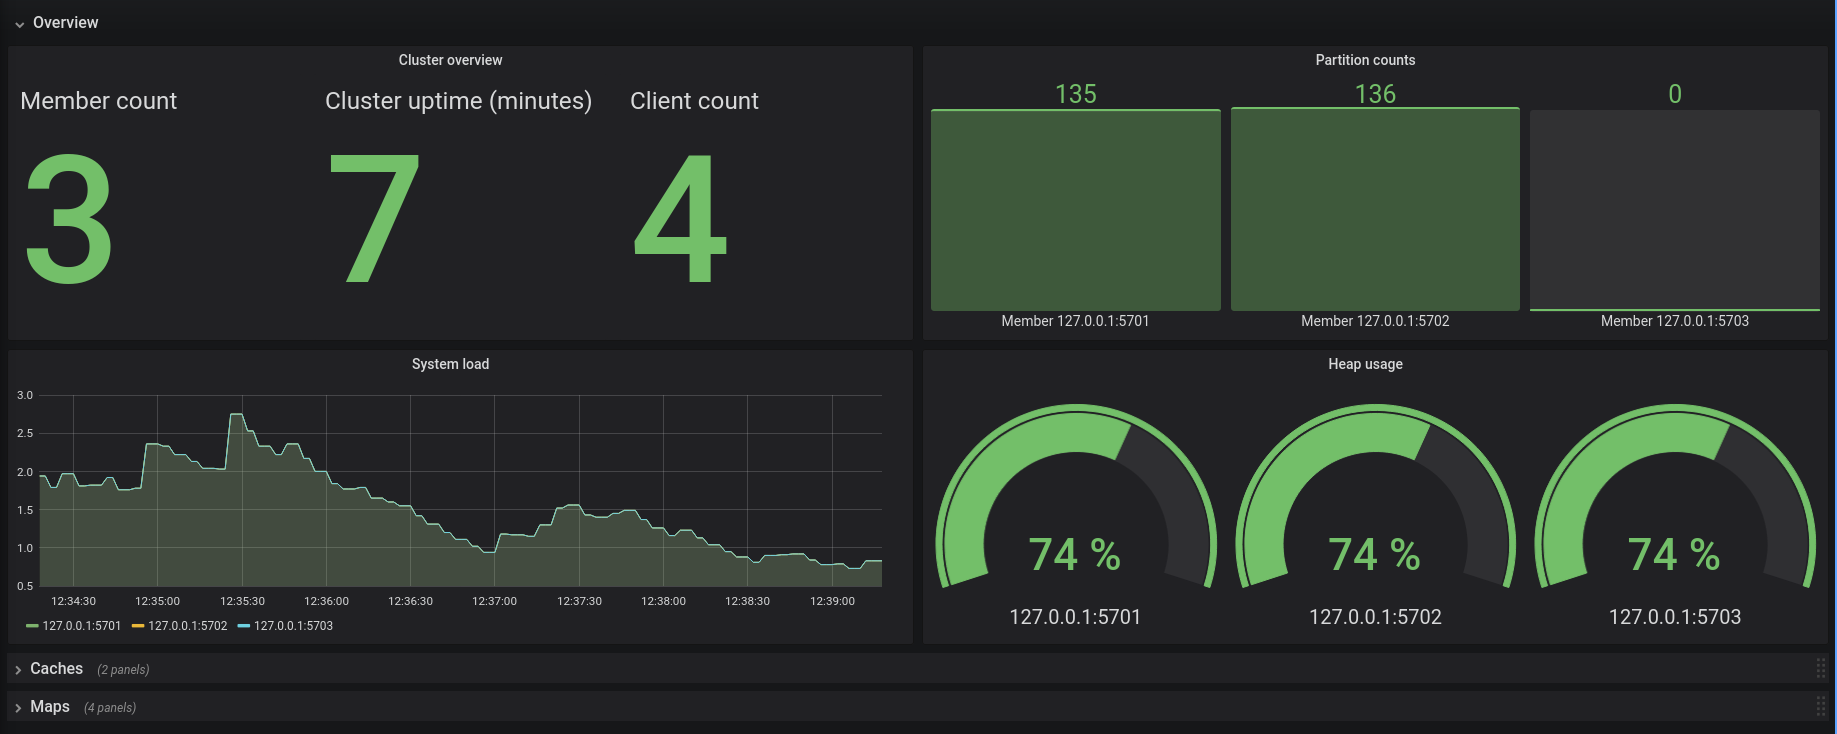
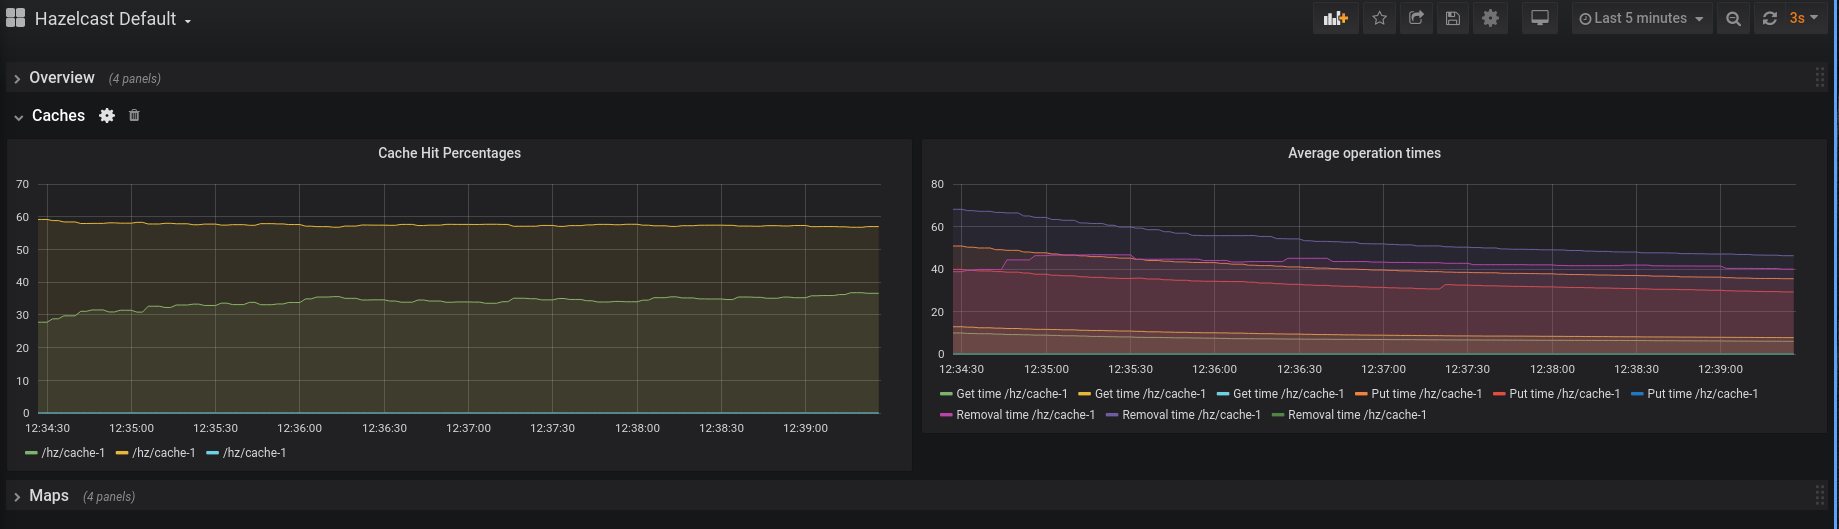
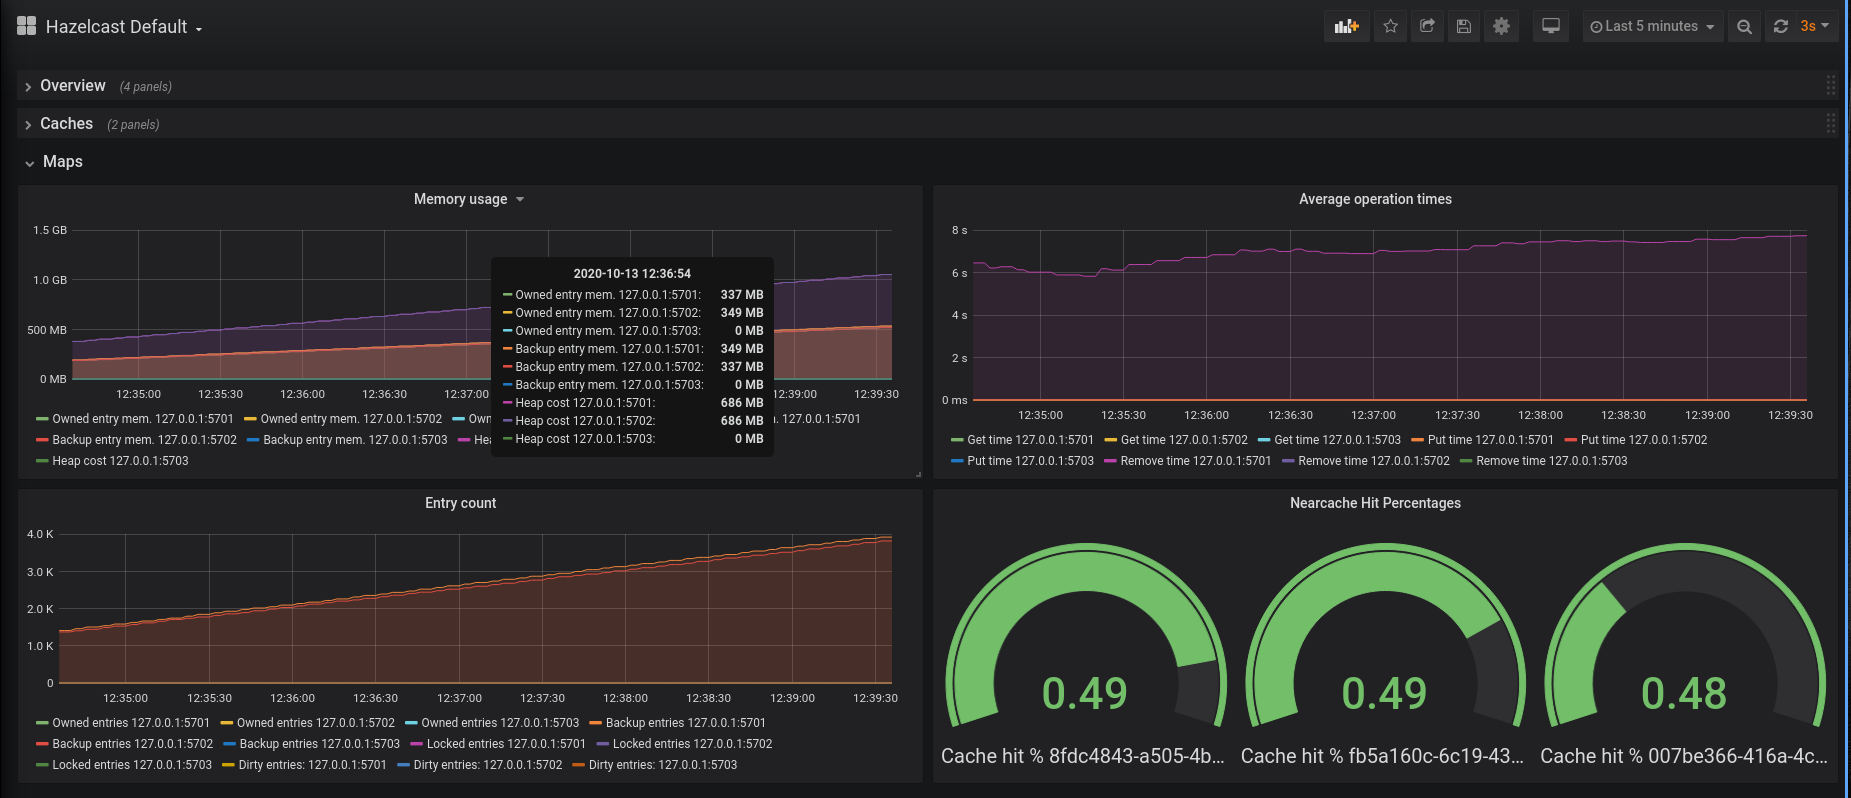
Dashboard for monitoring Hazelcast IMDG clusters.
Screenshots
Used Metrics 2626
hz_cache_averageGetTime
hz_cache_averagePutTime
hz_cache_averageRemovalTime
hz_cache_cacheHitPercentage
hz_client_endpoint_count
hz_cluster_clock_clusterUpTime
hz_cluster_size
hz_map_backupEntryCount
hz_map_backupEntryMemoryCost
hz_map_dirtyEntryCount
hz_map_entryCount
hz_map_getCount
hz_map_heapCost
hz_map_lockedEntryCount
hz_map_ownedEntryMemoryCost
hz_map_putCount
hz_map_removeCount
hz_map_totalGetLatency
hz_map_totalPutLatency
hz_map_totalRemoveLatency
hz_memory_freeHeap
hz_memory_usedHeap
hz_nearcache_hits
hz_nearcache_misses
hz_os_systemLoadAverage
hz_partitions_activePartitionCount
Get Dashboard✕
Download
Copy to Clipboard