Harbor Overview 29,19629,196
10/5/2023
12/7/2024
1
>=10.1.2
Prometheus
Description
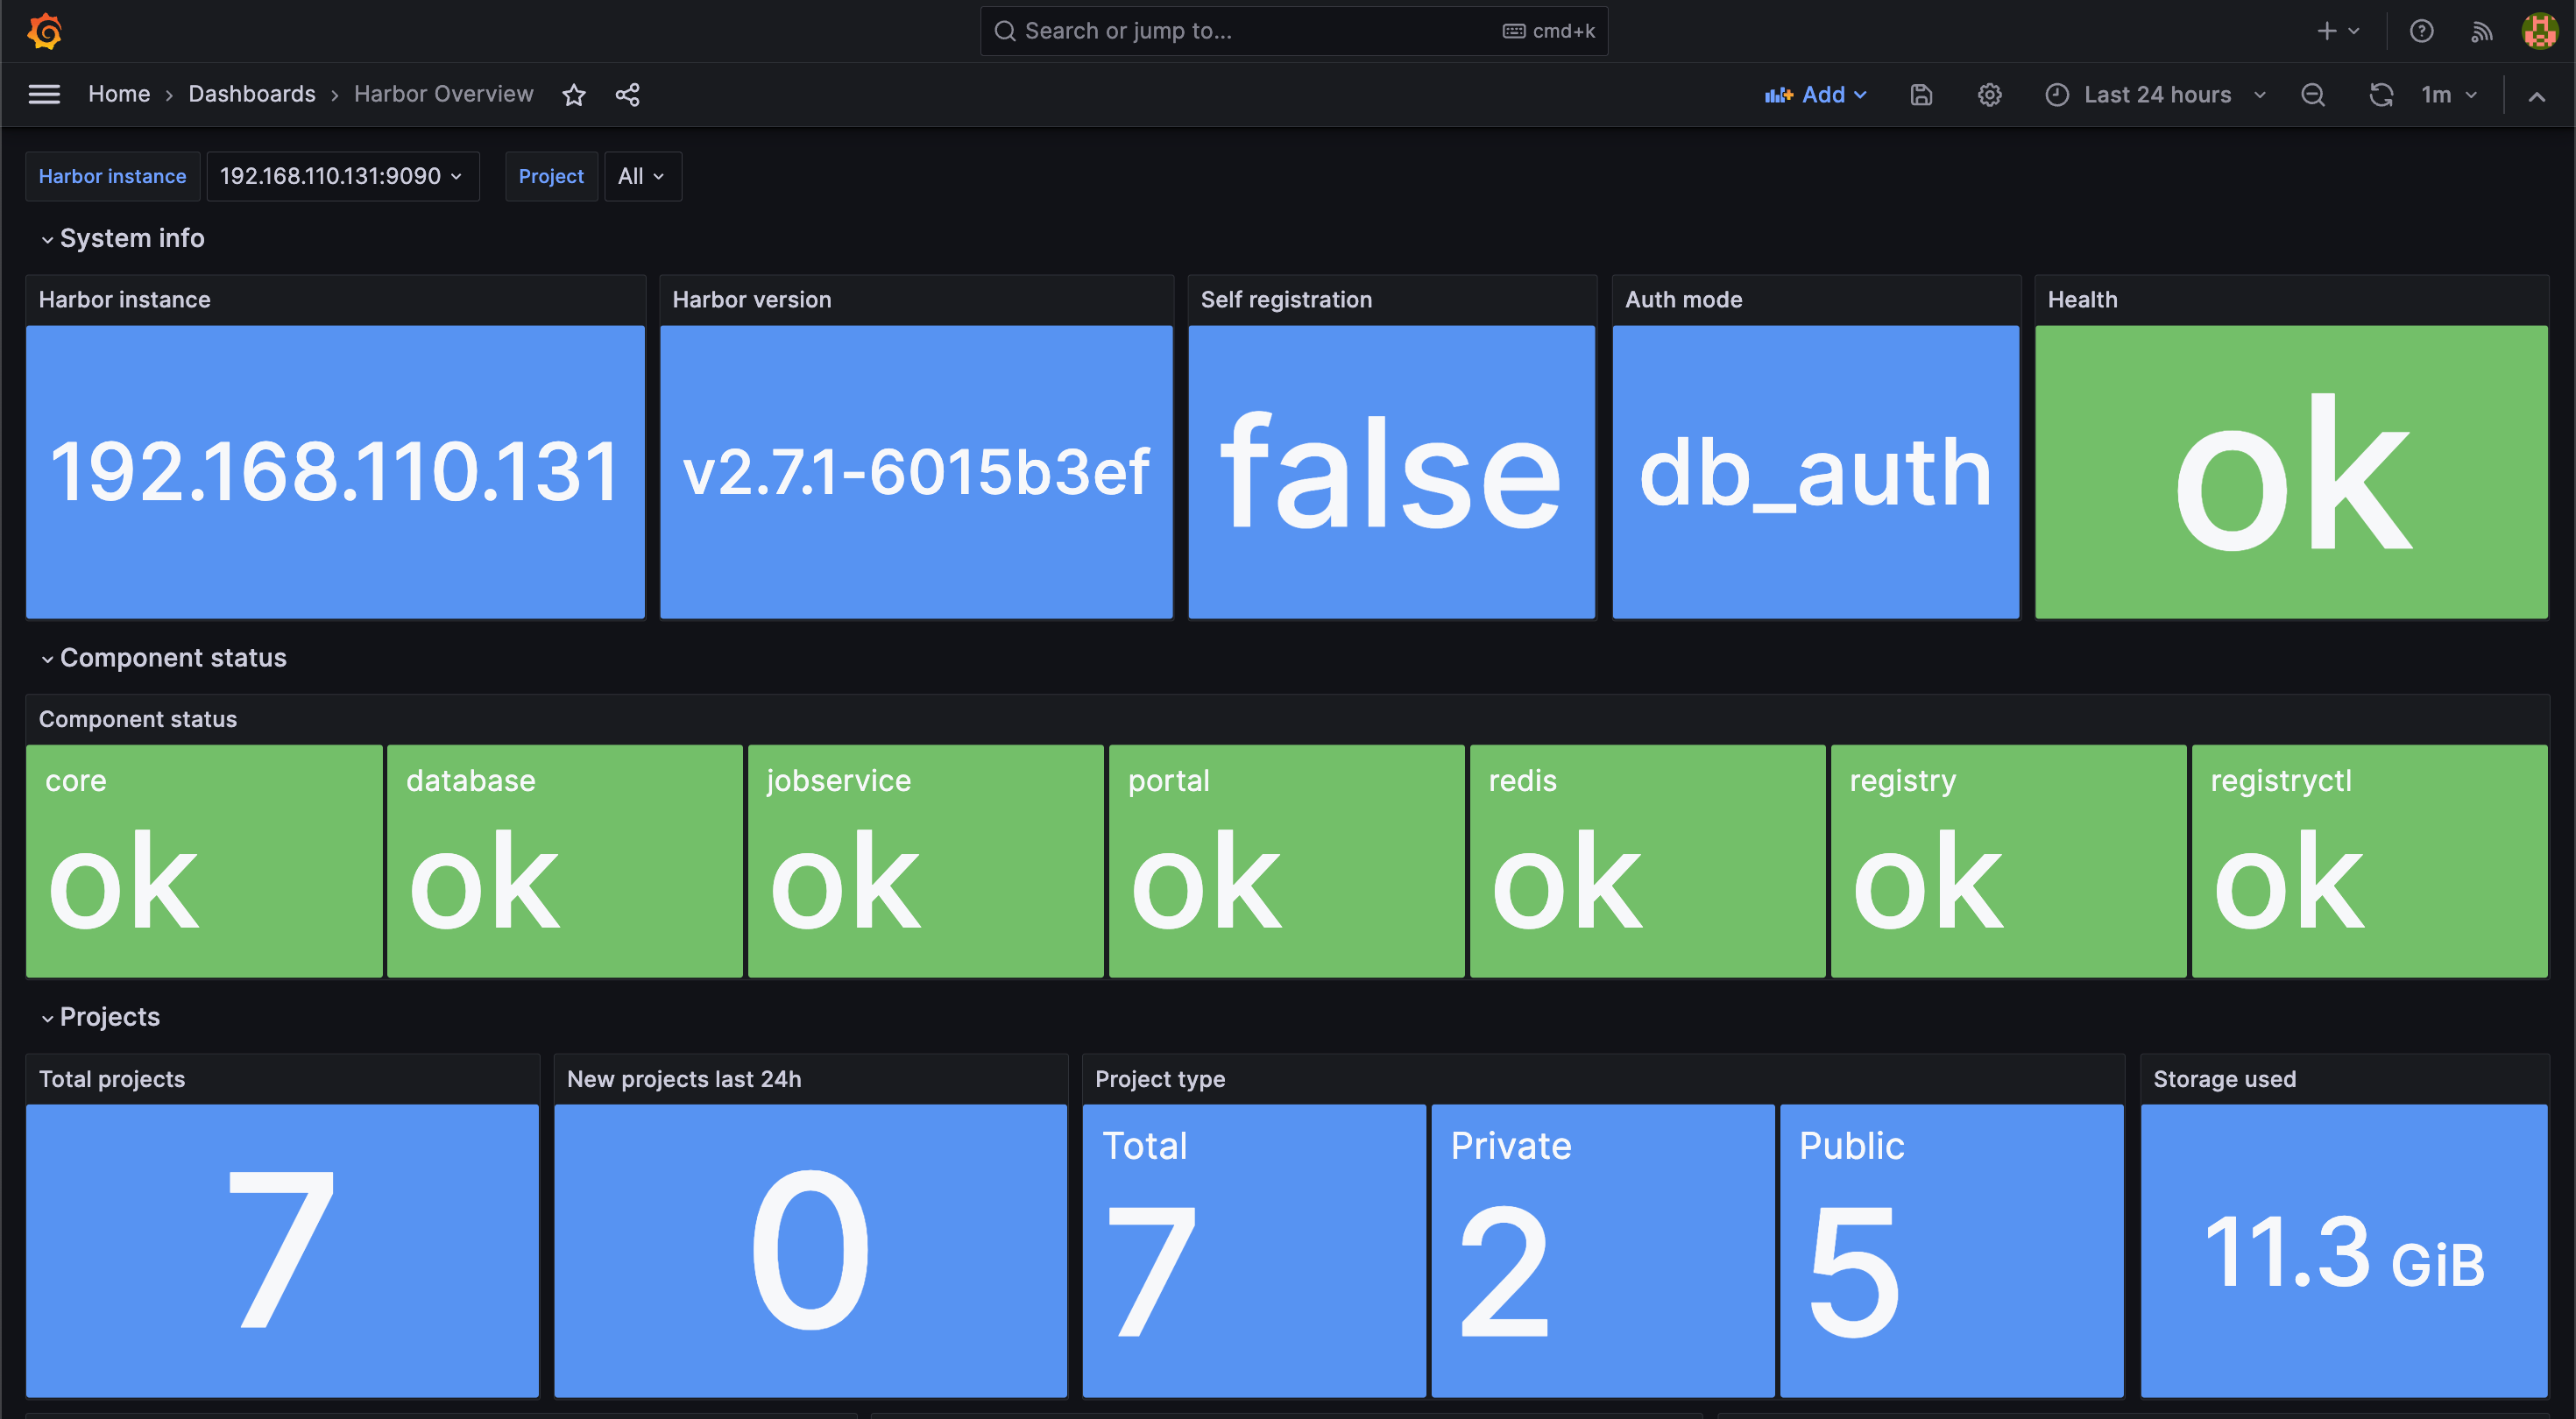
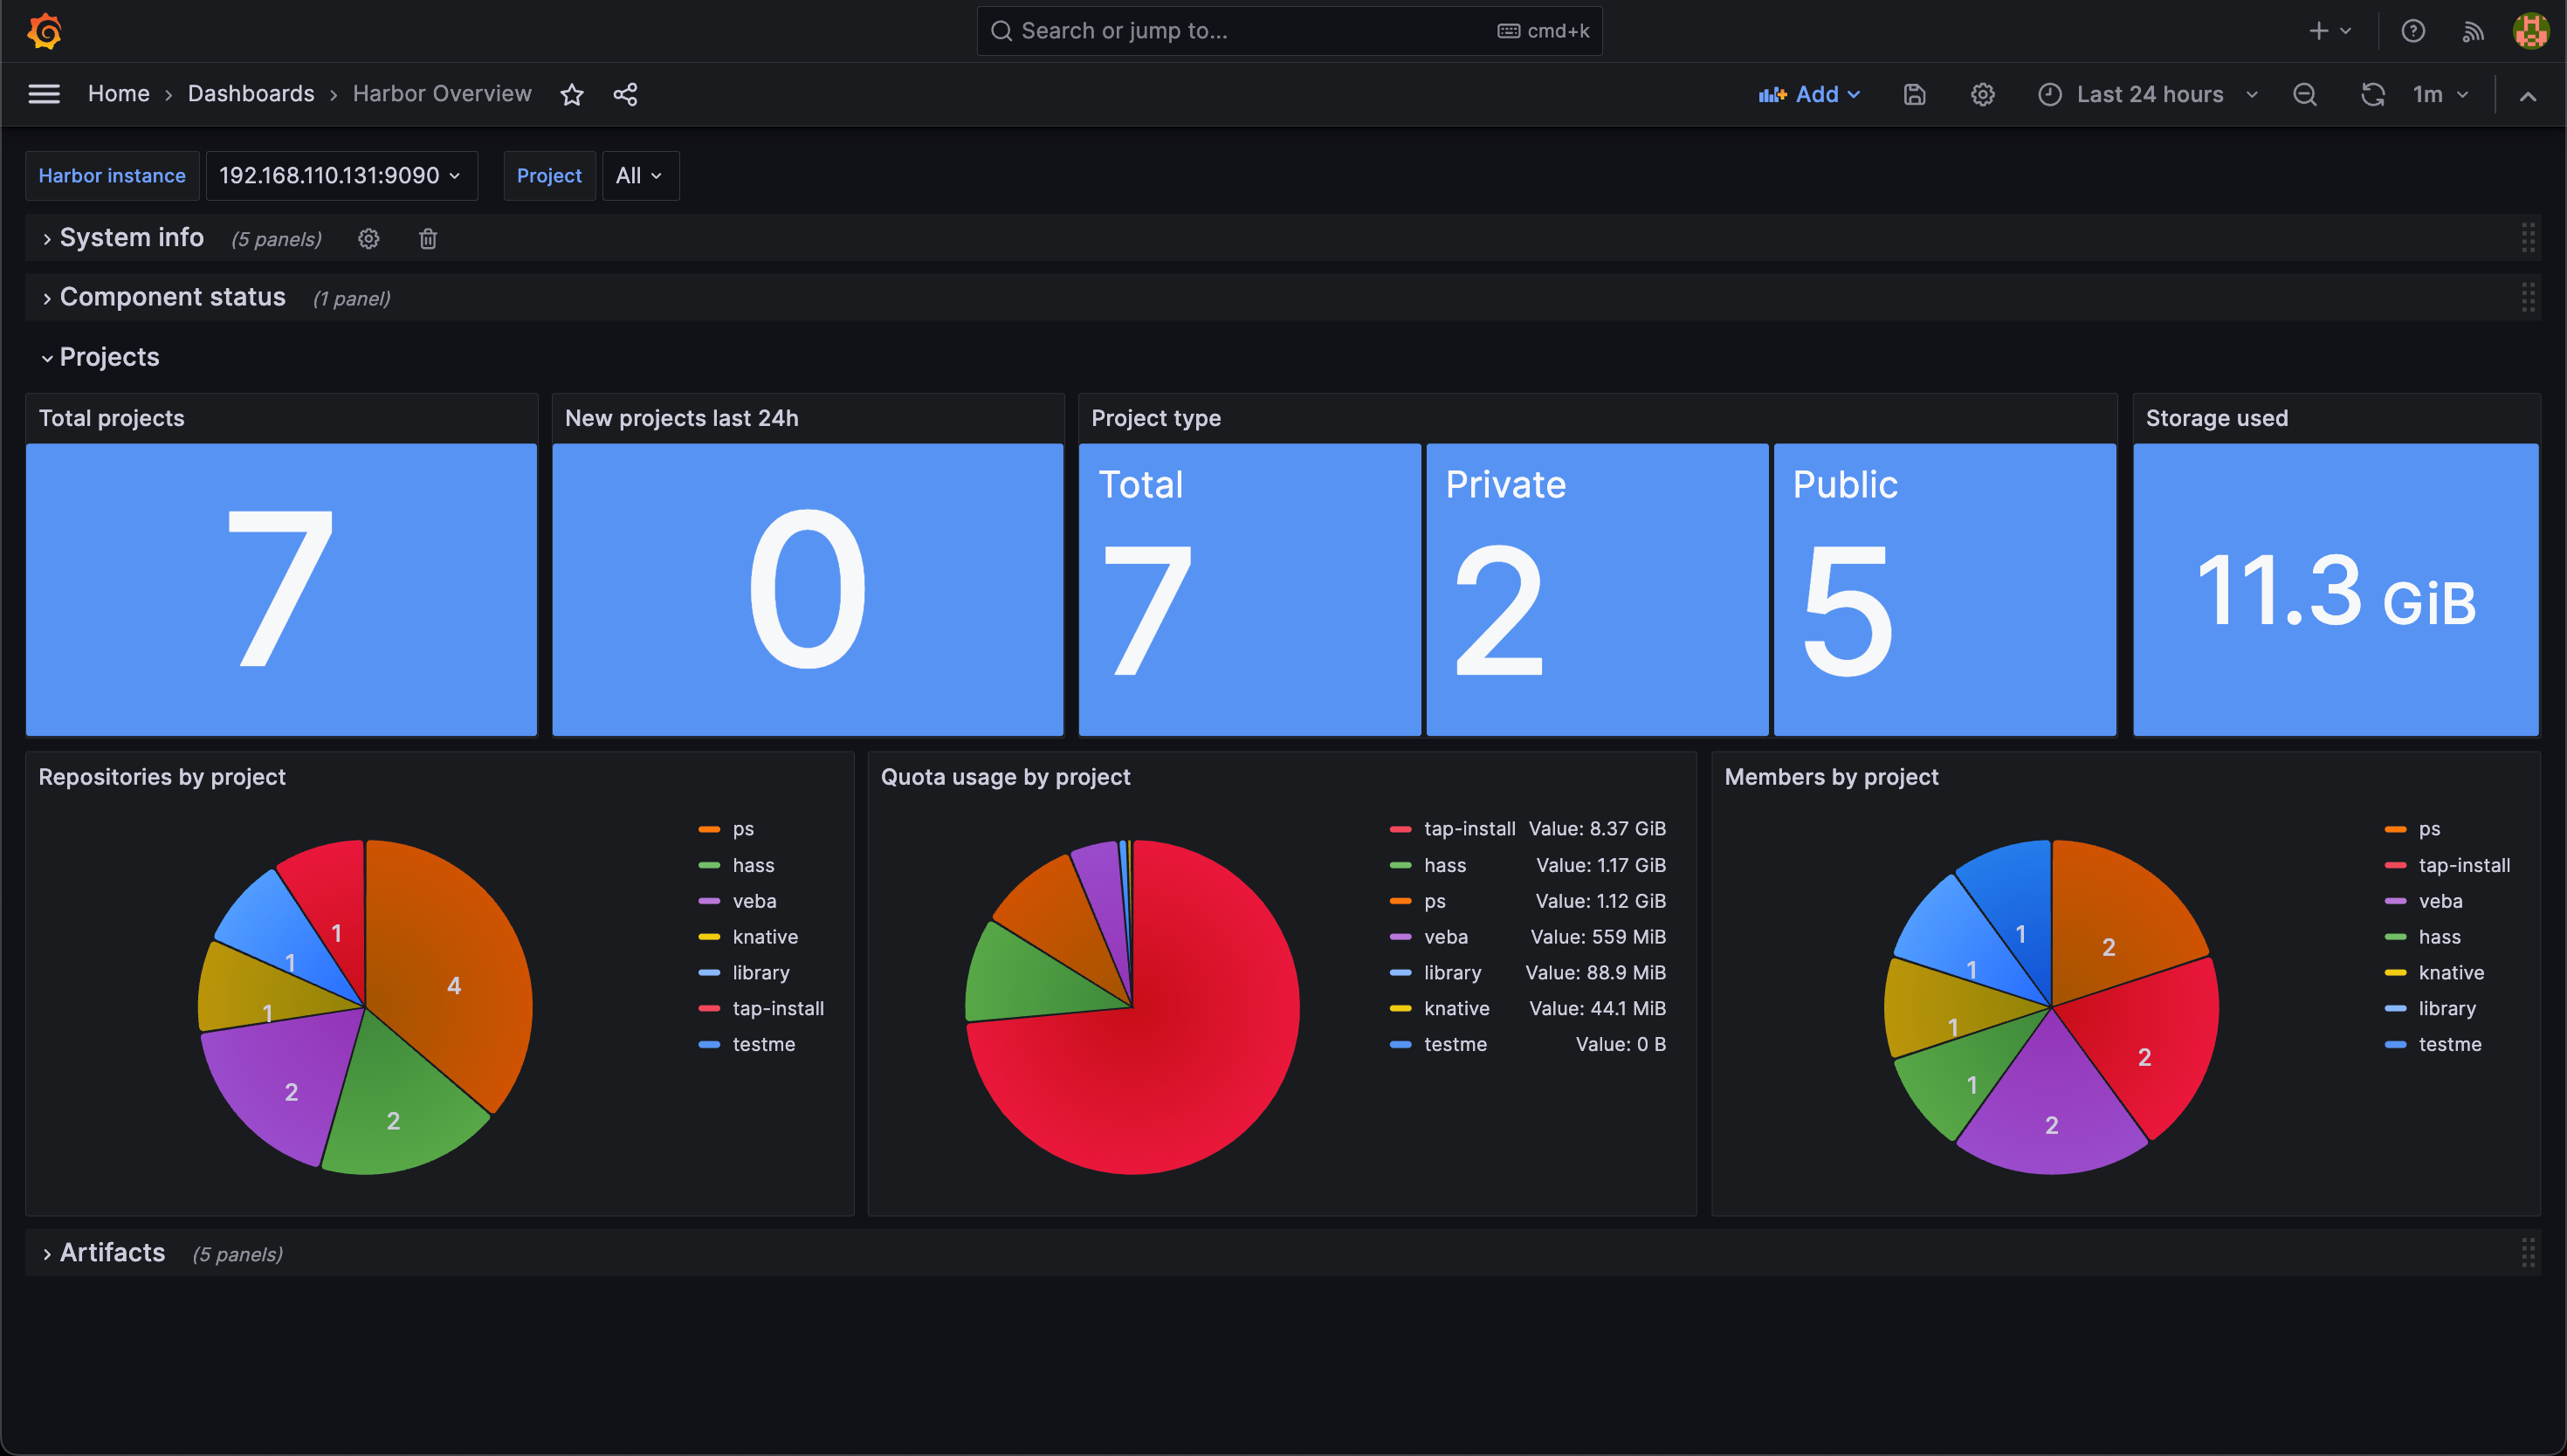
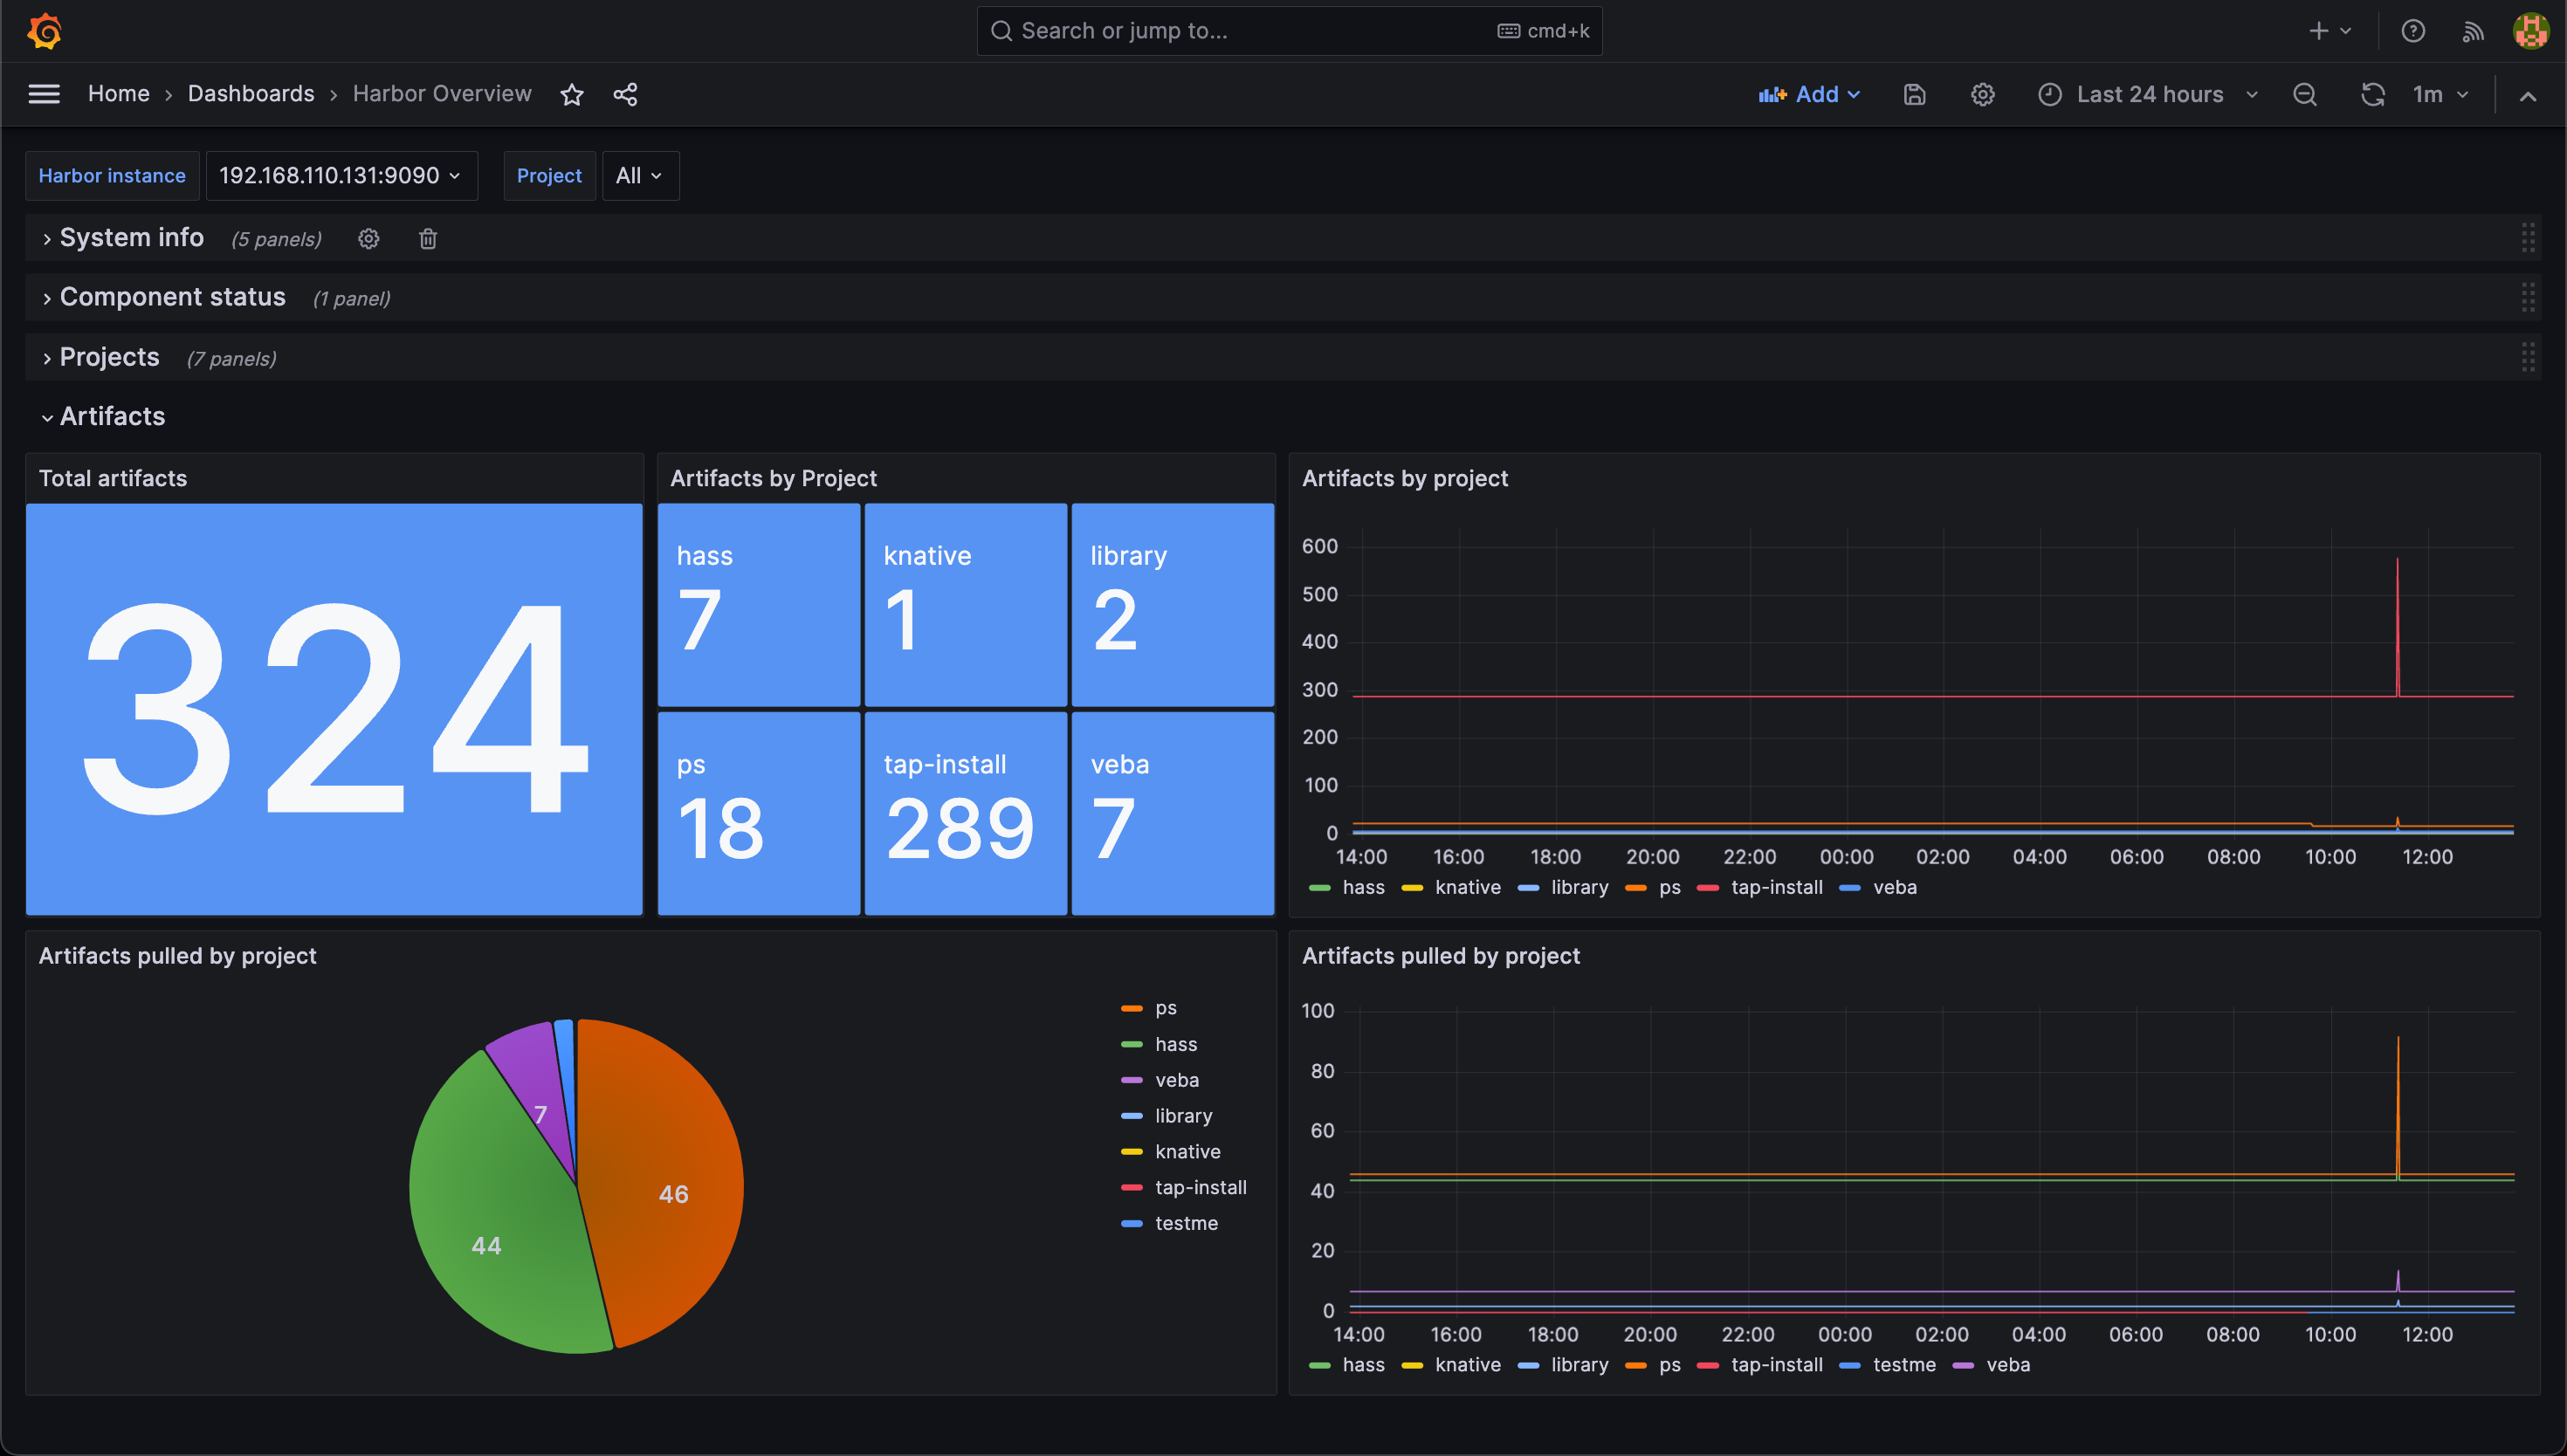
Overview Dashboard for the open-source Harbor Image Repository
Screenshots
Used Metrics 99
:9090
harbor_health
harbor_project_member_total
harbor_project_quota_usage_byte
harbor_project_repo_total
harbor_project_total
harbor_system_info
harbor_up
instance
Get Dashboard✕
Download
Copy to Clipboard