
Harbor-Monitoring 867867
10/8/2019
10/8/2019
1
Host Metrics
>=6.2.0
Prometheus
Description
This is a simple Grafana Dashboard to display Host Metrics such CPU, Memory, DISK IO, Load Average, collected using the Node Exporter
Screenshots
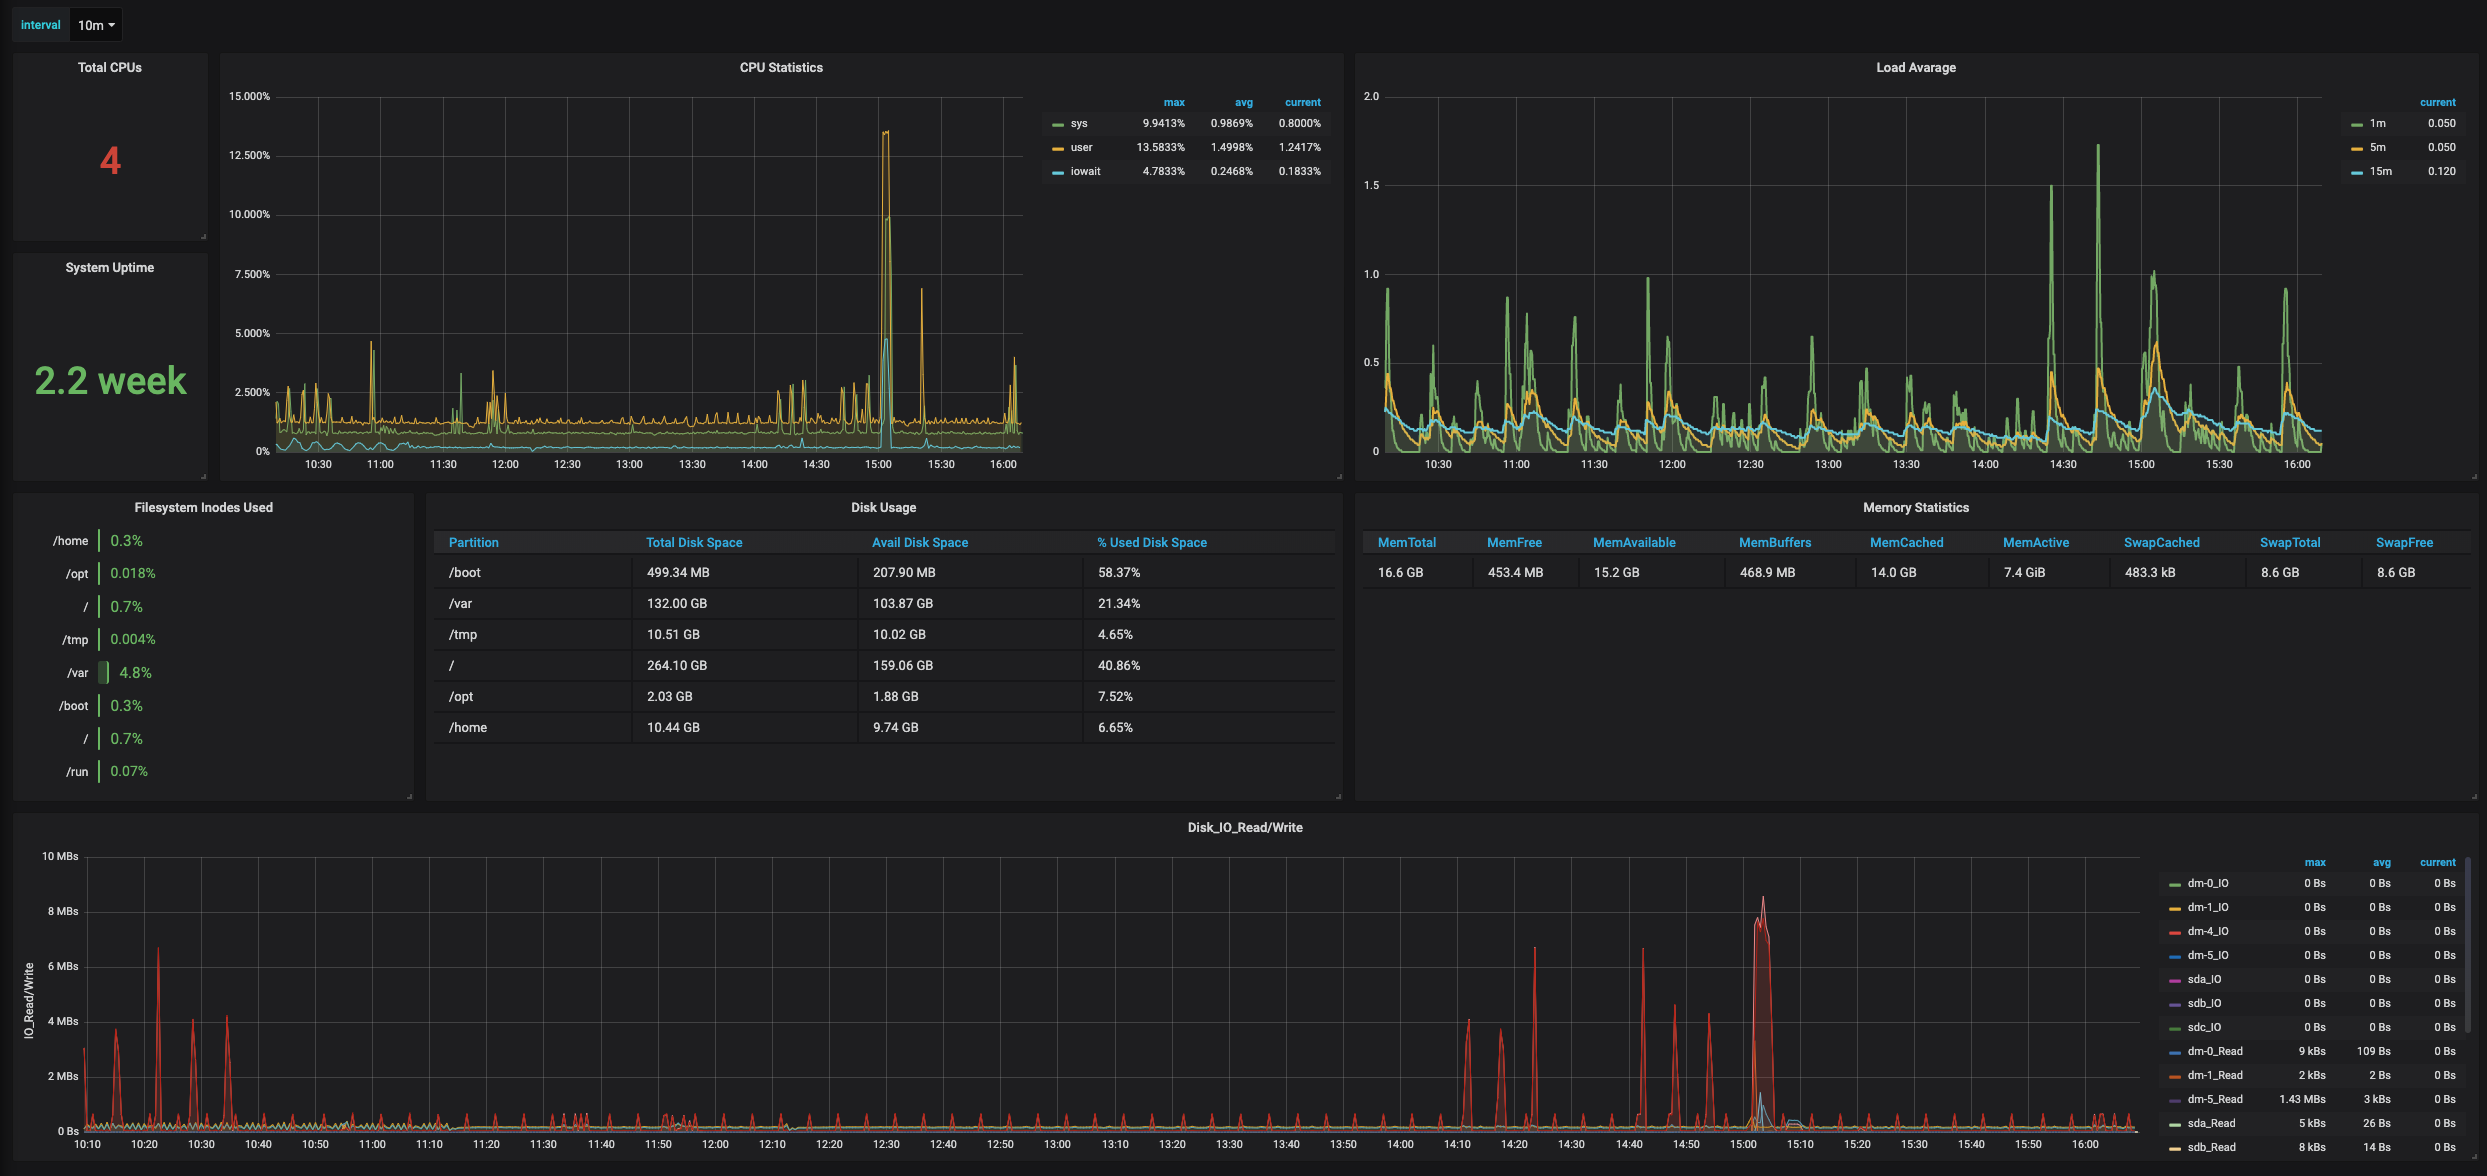
Used Metrics 2222
interval
-
node_boot_time_seconds
-
node_cpu_seconds_total
-
node_disk_io_time_seconds_total
-
node_disk_read_bytes_total
-
node_disk_written_bytes_total
-
node_filesystem_avail_bytes
-
node_filesystem_files
-
node_filesystem_files_free
-
node_filesystem_size_bytes
-
node_load1
-
node_load15
-
node_load5
-
node_memory_Active_bytes
-
node_memory_Buffers_bytes
-
node_memory_Cached_bytes
-
node_memory_MemAvailable_bytes
-
node_memory_MemFree_bytes
-
node_memory_MemTotal_bytes
-
node_memory_SwapCached_bytes
-
node_memory_SwapFree_bytes
-
node_memory_SwapTotal_bytes
Get Dashboard✕
Download
Copy to Clipboard