Prom
hub
Alerts
Dashboards
Exporters
Metrics
Alerts
Dashboards
Exporters
Metrics
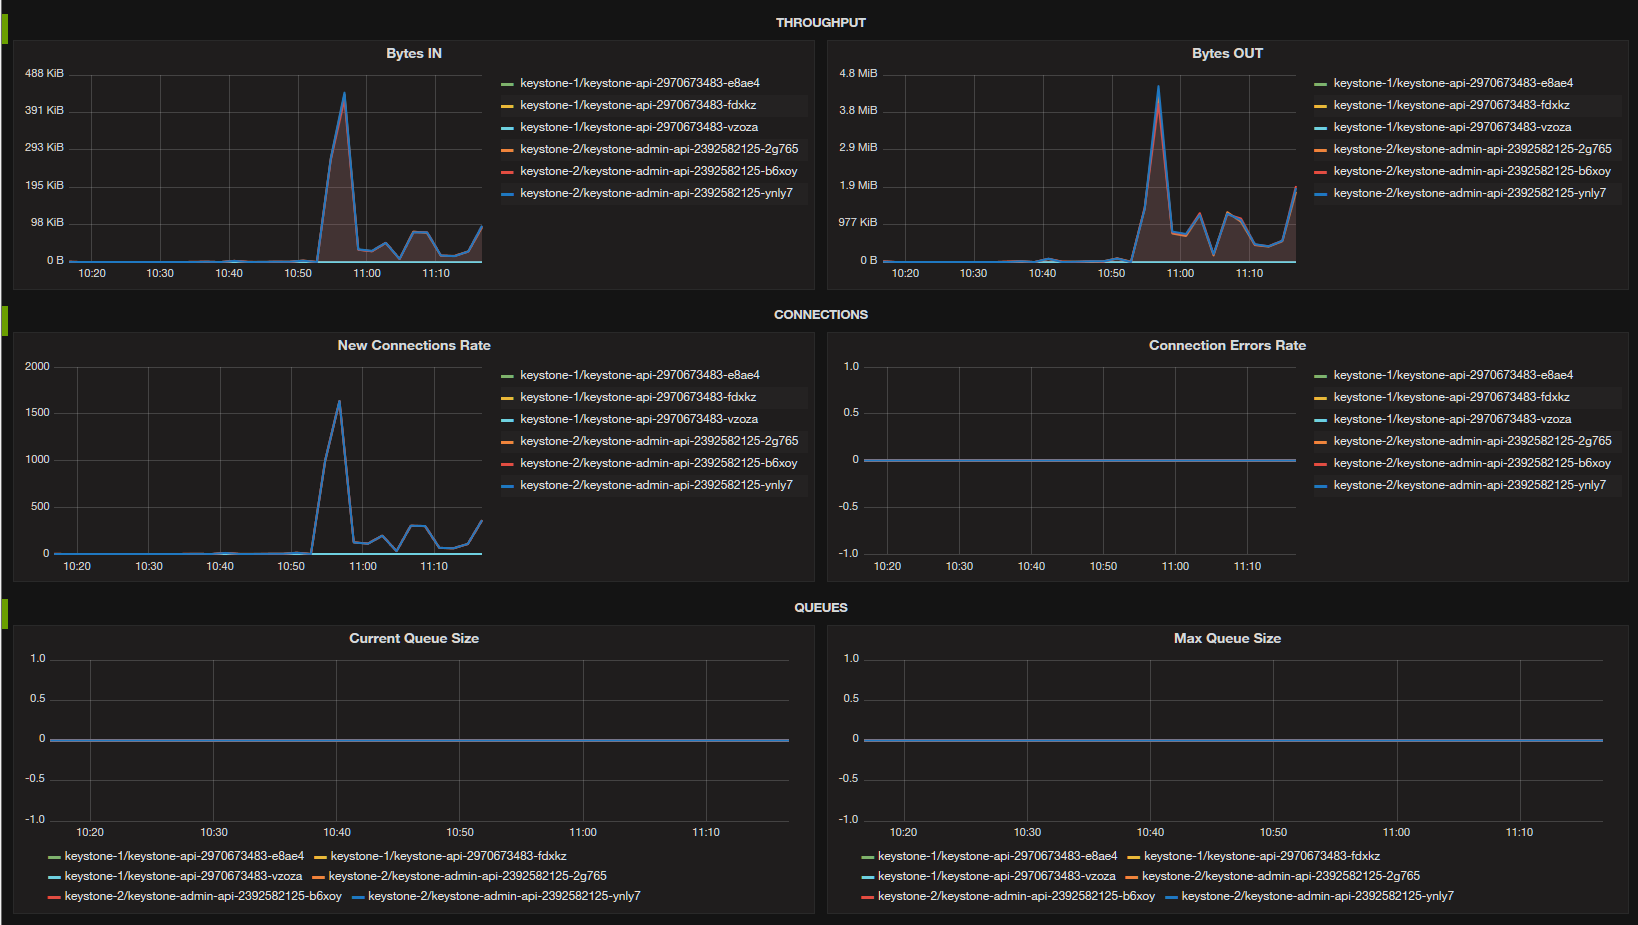
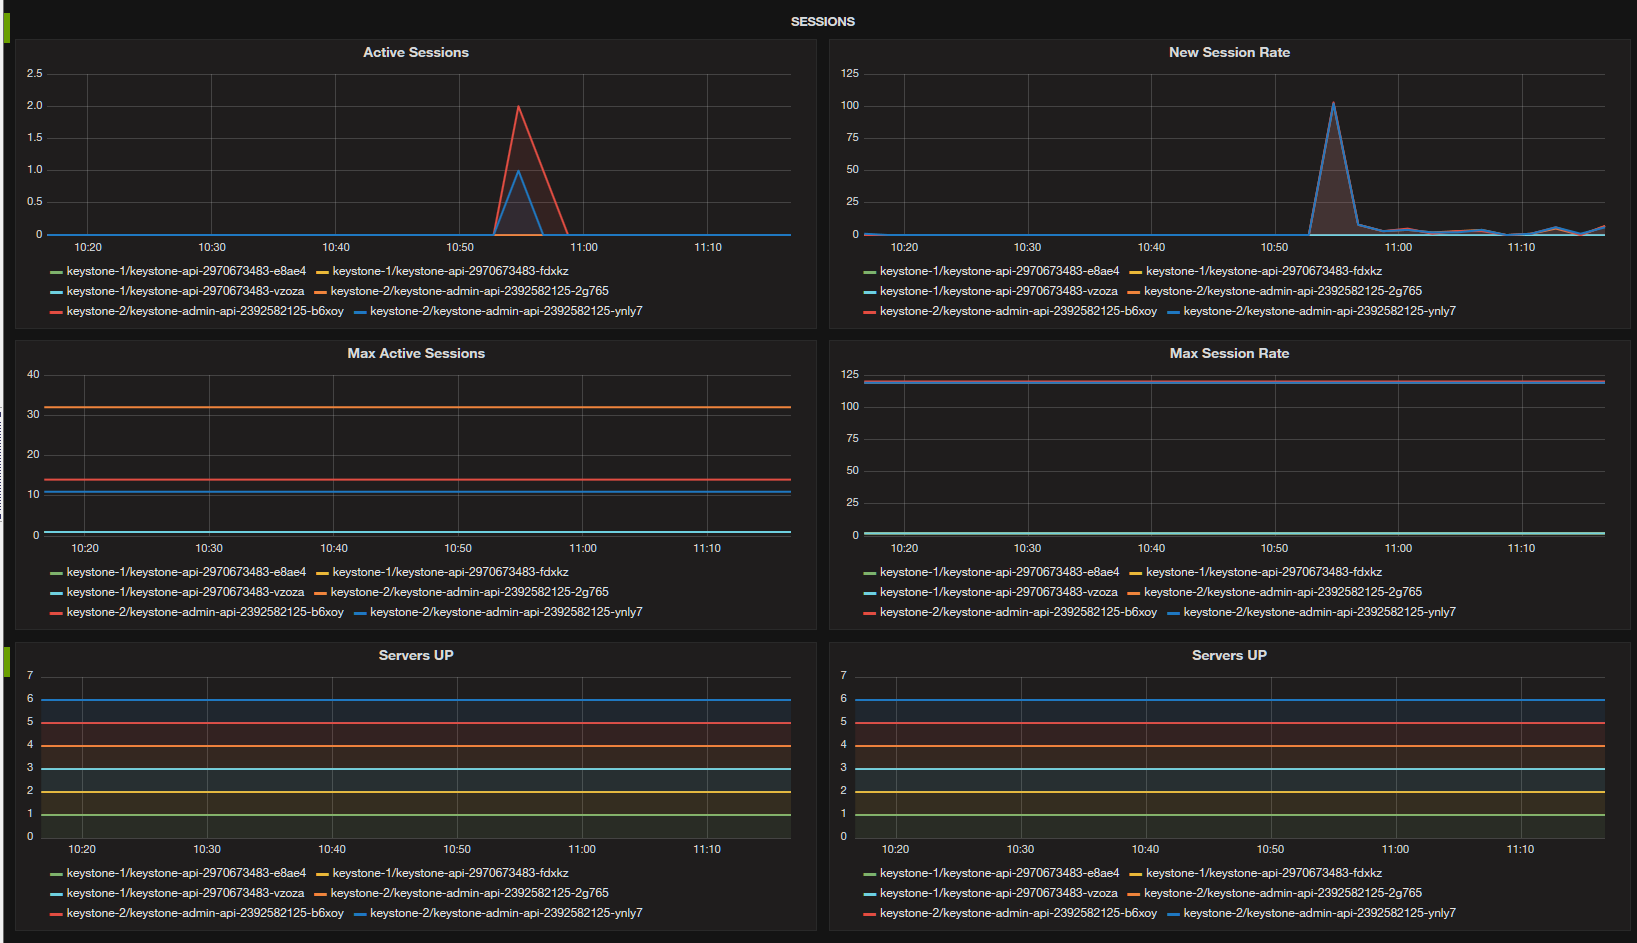
HAproxy Servers | HAproxy
1
4
,
4
0
7
14,407
Show Preview
Get Dashboard
Download
Copy to Clipboard
Created
8/26/2016
Updated
3/10/2017
Revision
3
Categories
Web Servers
Grafana Version
>=4.1.2
Datasources
Prometheus
Description
HAproxy backend servers
Screenshots
1
2
Source
Grafana.com
Get Dashboard
✕
Download
Copy to Clipboard
✕
Dashboard Preview - HAproxy Servers | HAproxy
Most Grafana dashboards are not optimized for small screens. For the best experience, view this preview on a larger screen.
grafana.shipit.dev/haproxy-servers-haproxy
close