HAProxy Metrics - Single 1,4991,499
6/6/2018
6/6/2018
1
>=5.0.4
Prometheus
Description
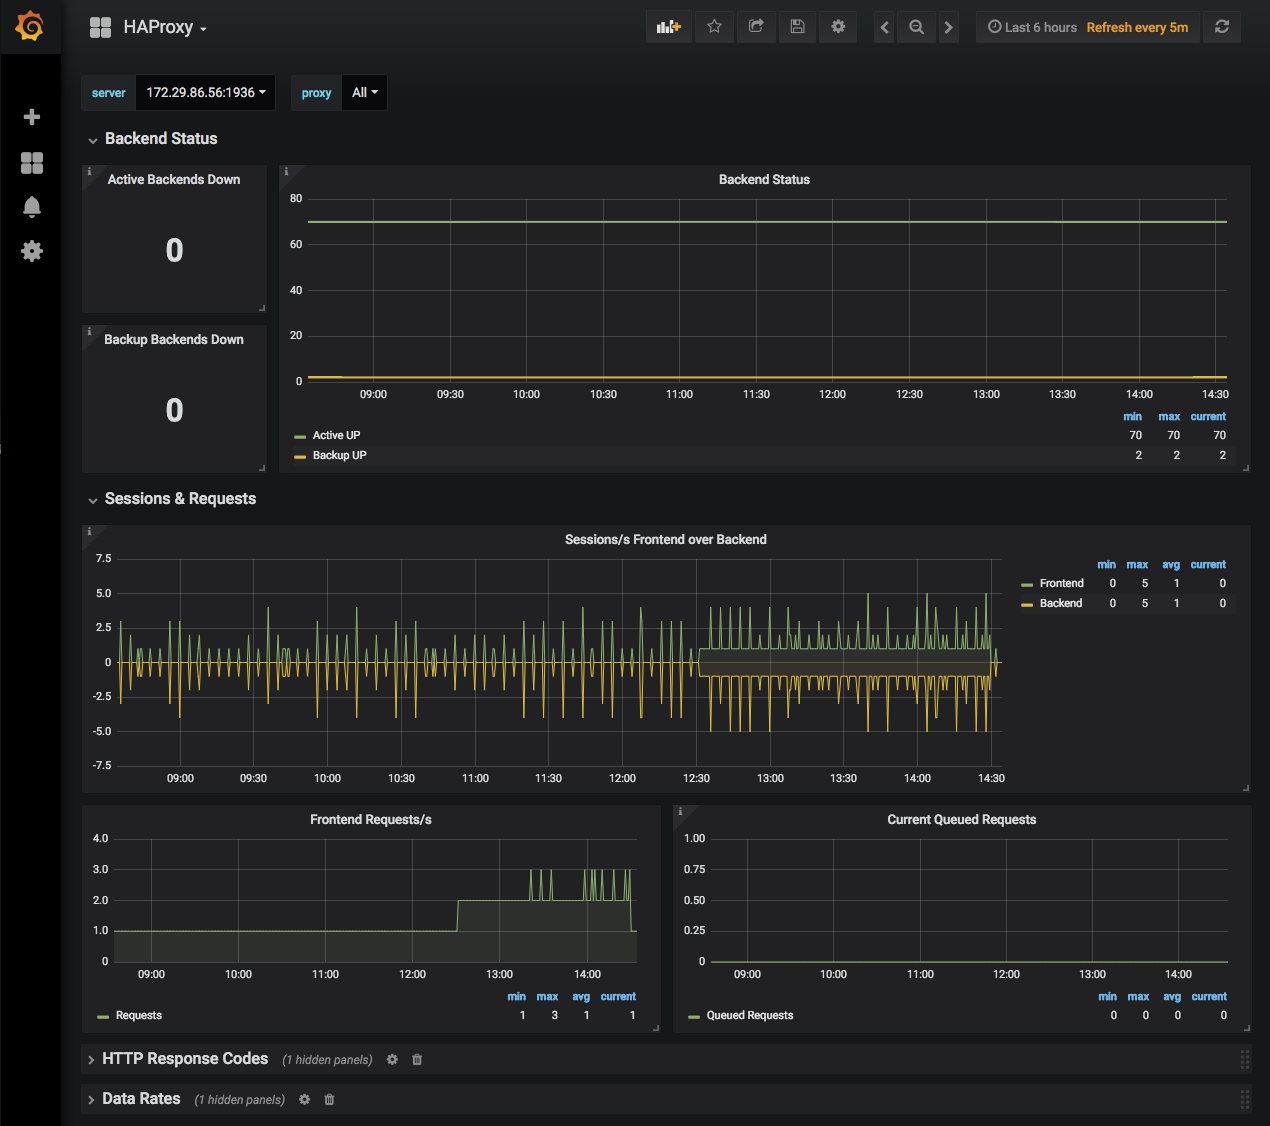
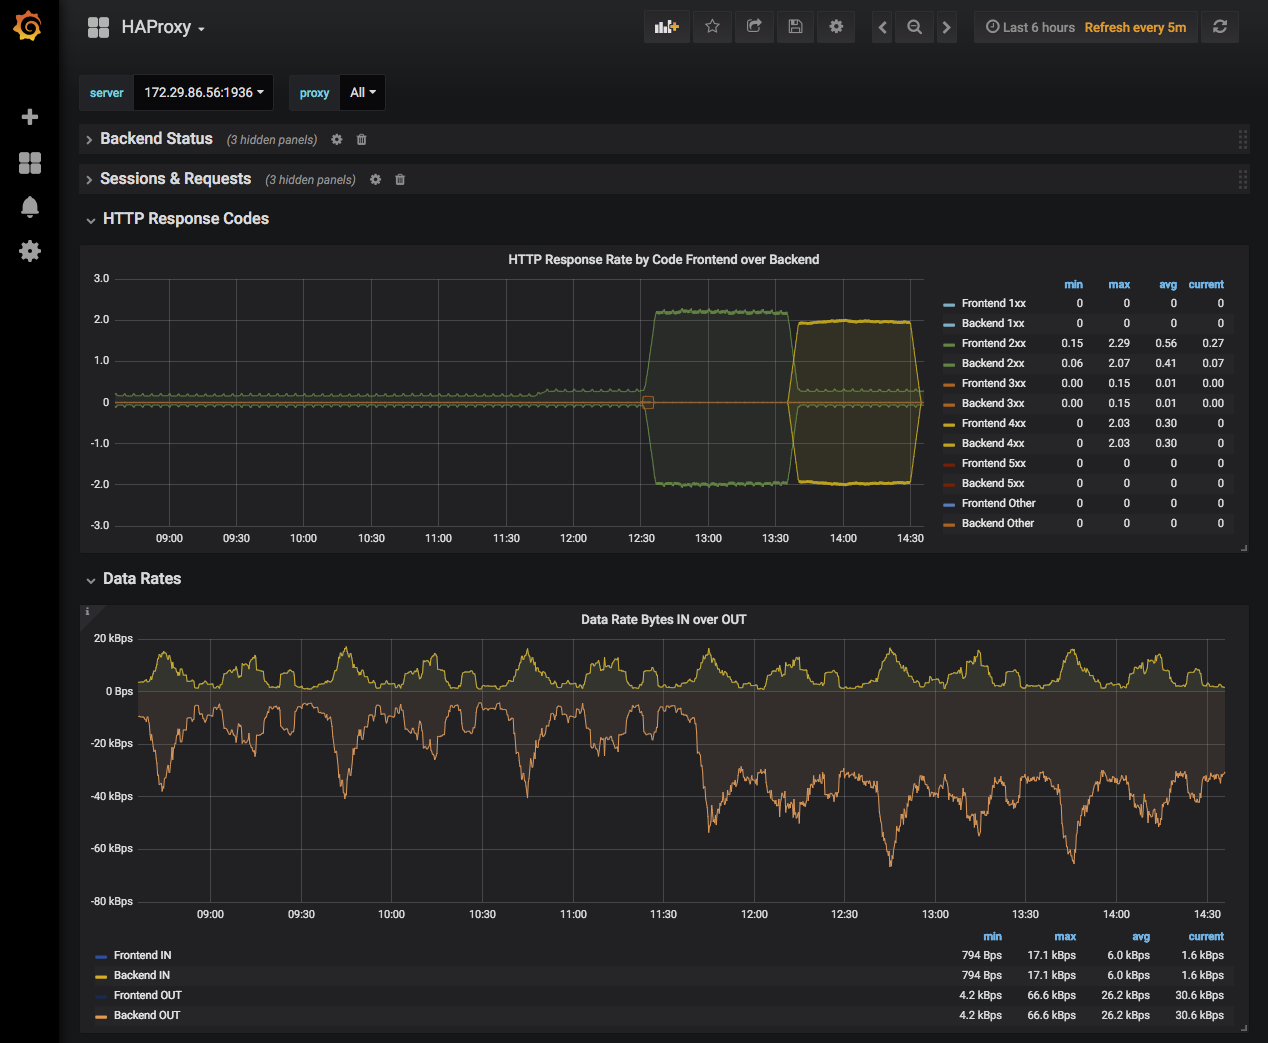
HAProxy metrics and statistics
Screenshots
Used Metrics 1313
haproxy_active_servers
haproxy_backup_servers
haproxy_bin
haproxy_bout
haproxy_http_response_1xx
haproxy_http_response_2xx
haproxy_http_response_3xx
haproxy_http_response_4xx
haproxy_http_response_5xx
haproxy_http_response_other
haproxy_qcur
haproxy_rate
haproxy_req_rate
Get Dashboard✕
Download
Copy to Clipboard