HAProxy 1,293,4001,293,400 4.6 (9 reviews)
Description
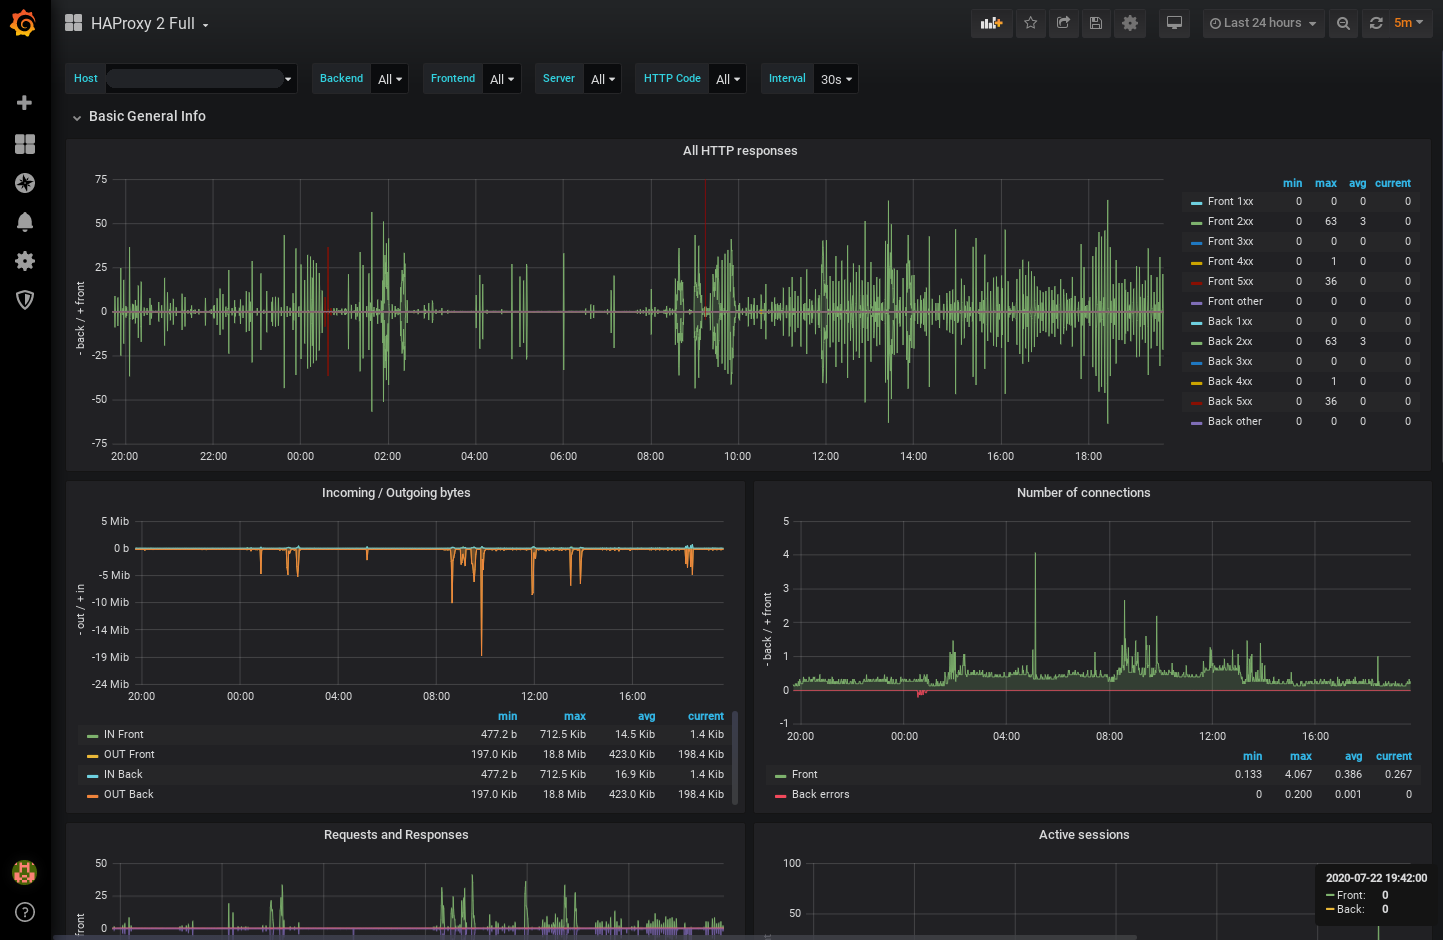
This dashboard monitors HAProxy traffic and health by aggregating frontend and backend metrics to show request/response counts, data throughput, and session activity.Key features include real-time HTTP request/response tallies (haproxy_frontend_http_requests_total, haproxy_backend_http_requests_total, haproxy_frontend_http_responses_total, haproxy_backend_http_responses_total), byte throughput (haproxy_frontend_bytes_in_total, haproxy_frontend_bytes_out_total, haproxy_backend_bytes_in_total, haproxy_backend_bytes_out_total), and session and connection visibility (haproxy_frontend_sessions_total, haproxy_backend_sessions_total), with panels such as HTTP response/request, data transfer, sessions, connections, and status indicators for UP and Uptime.
Screenshots
Used Metrics 1515
haproxy_backend_bytes_in_total
haproxy_backend_bytes_out_total
haproxy_backend_connection_attempts_total
haproxy_backend_http_requests_total
haproxy_backend_http_responses_total
haproxy_backend_sessions_total
haproxy_backend_status
haproxy_frontend_bytes_in_total
haproxy_frontend_bytes_out_total
haproxy_frontend_connections_total
haproxy_frontend_http_requests_total
haproxy_frontend_http_responses_total
haproxy_frontend_sessions_total
haproxy_frontend_status
haproxy_process_start_time_seconds