Hadoop HDFS FSImage 1,6611,661
Description
Used with Prometheus Hadoop HDFS FSImage Exporter in kubernetes
Screenshots
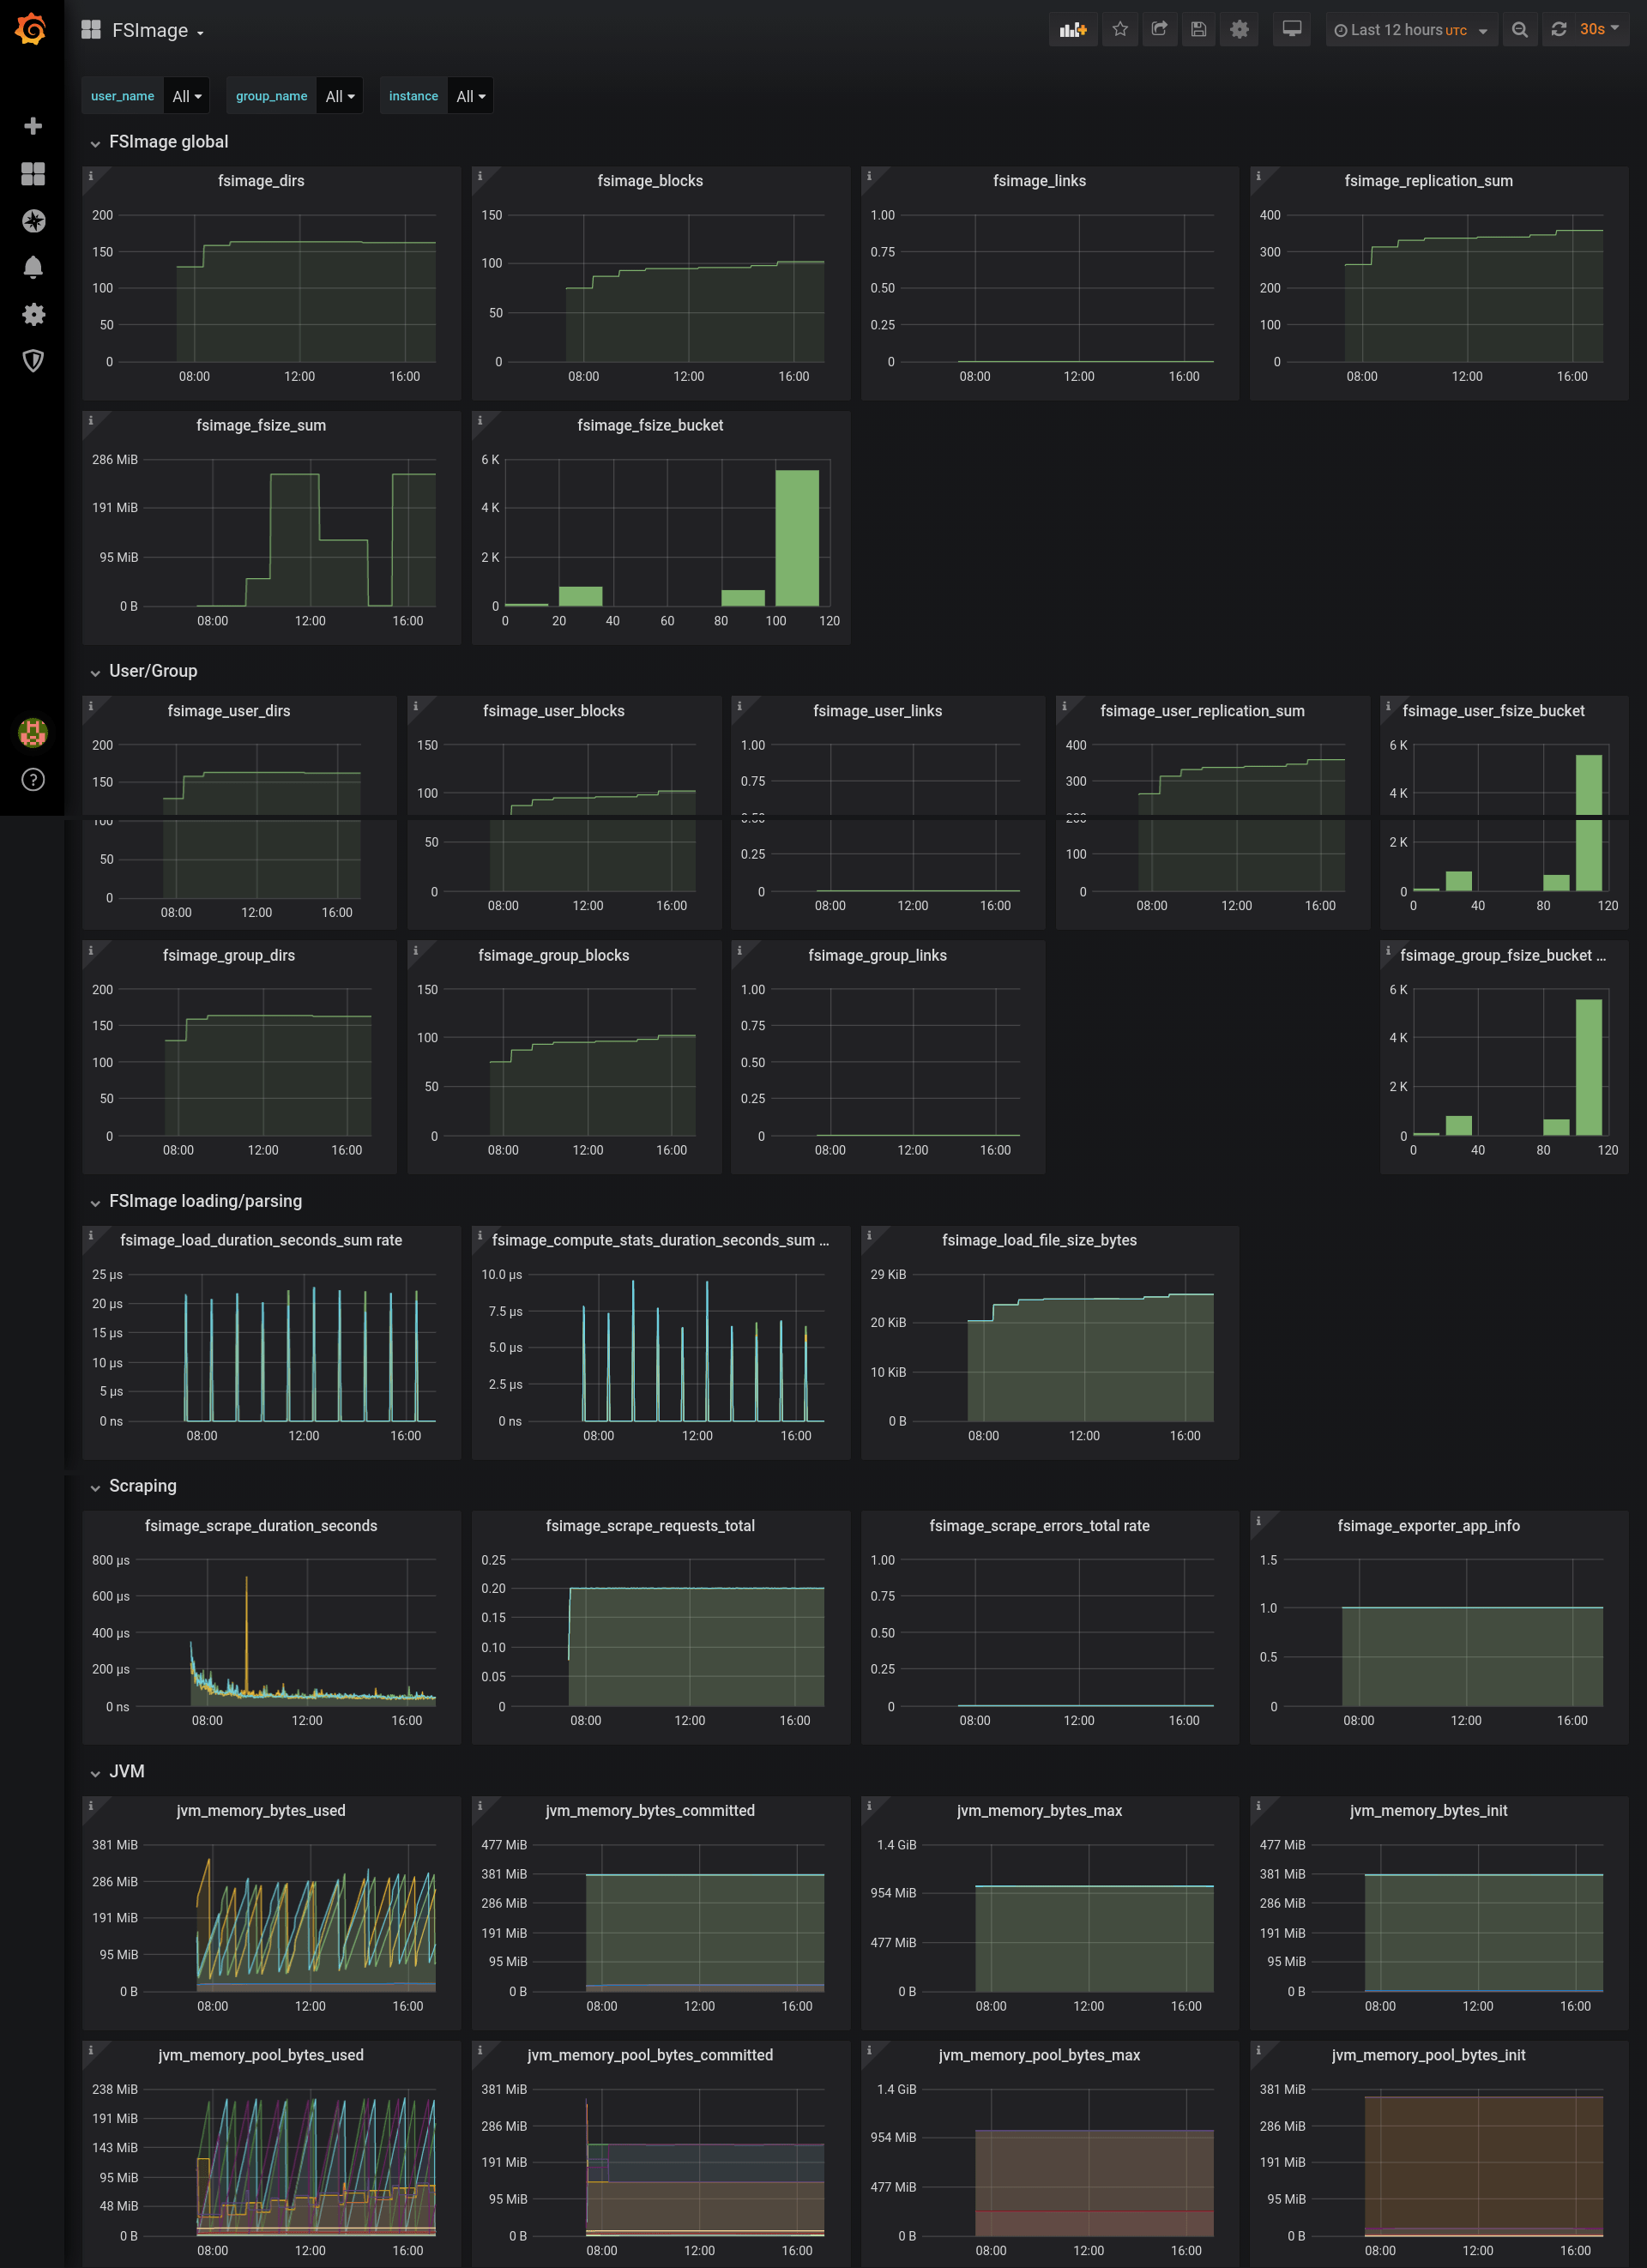
Used Metrics 3030
fsimage_blocks
fsimage_compute_stats_duration_seconds_sum
fsimage_dirs
fsimage_exporter_app_info
fsimage_fsize_bucket
fsimage_fsize_sum
fsimage_group_blocks
fsimage_group_dirs
fsimage_group_fsize_bucket
fsimage_group_links
fsimage_links
fsimage_load_duration_seconds_sum
fsimage_load_file_size_bytes
fsimage_replication_sum
fsimage_scrape_duration_seconds
fsimage_scrape_errors_total
fsimage_scrape_requests_total
fsimage_user_blocks
fsimage_user_dirs
fsimage_user_fsize_bucket
fsimage_user_links
fsimage_user_replication_sum
jvm_memory_bytes_committed
jvm_memory_bytes_init
jvm_memory_bytes_max
jvm_memory_bytes_used
jvm_memory_pool_bytes_committed
jvm_memory_pool_bytes_init
jvm_memory_pool_bytes_max
jvm_memory_pool_bytes_used