Grafana Internals 72,56172,561 4.5 (2 reviews)
10/30/2017
10/31/2017
3
Web Servers
>=4.6.0
Prometheus
Description
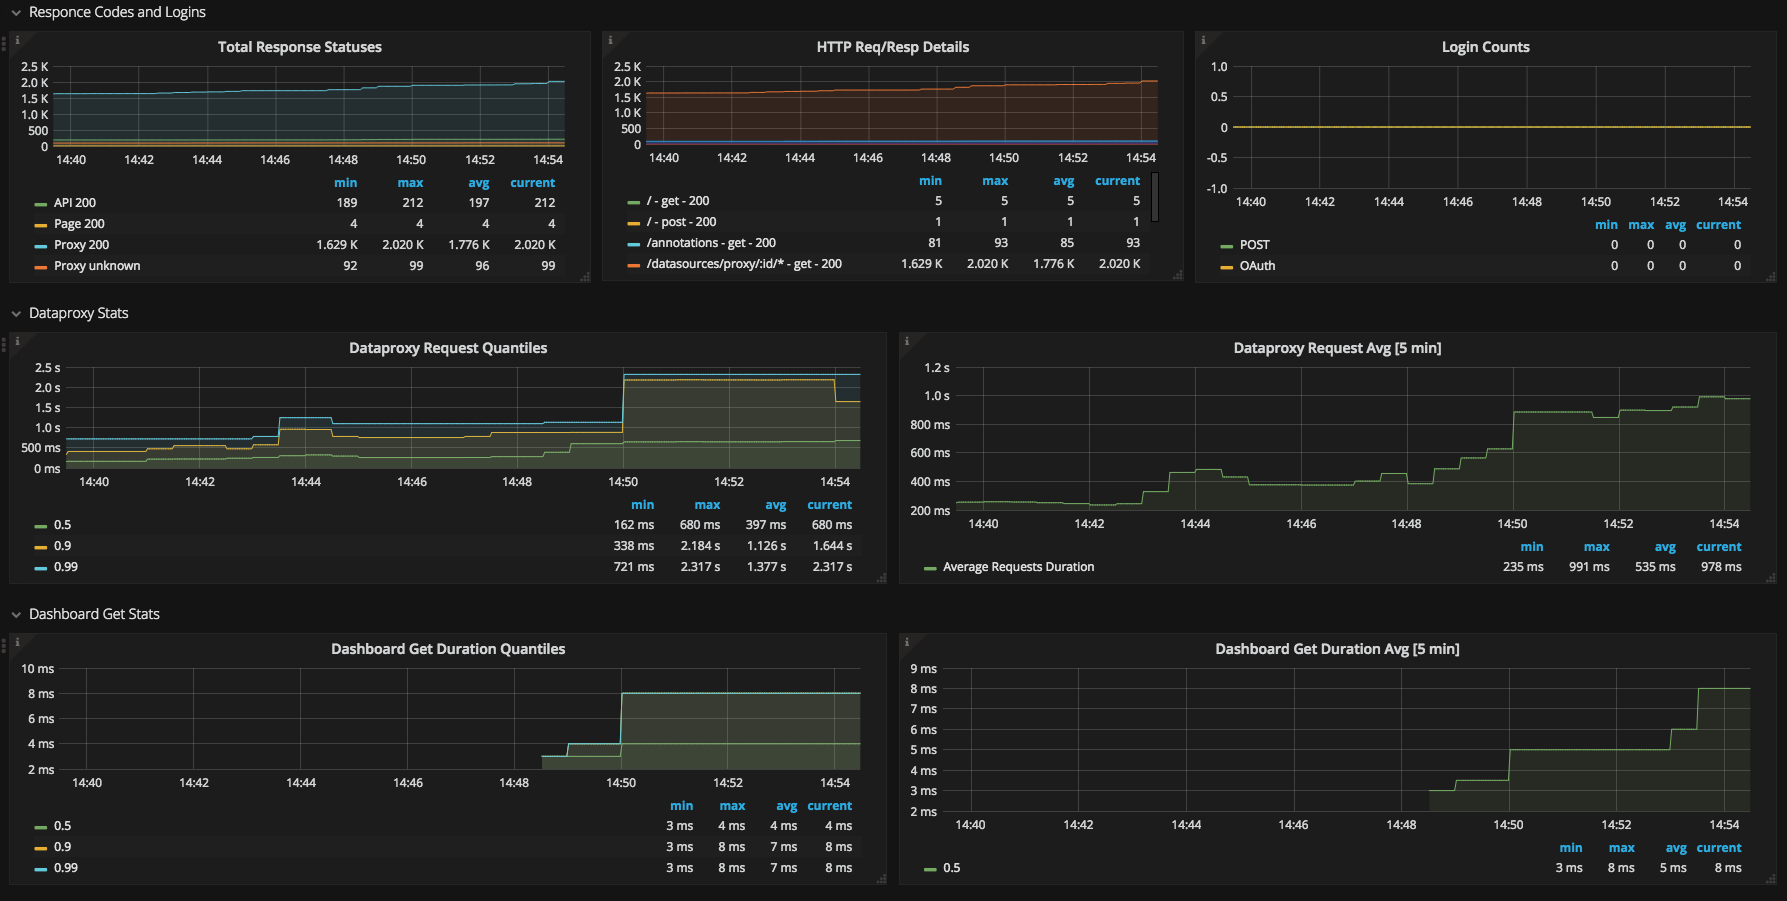
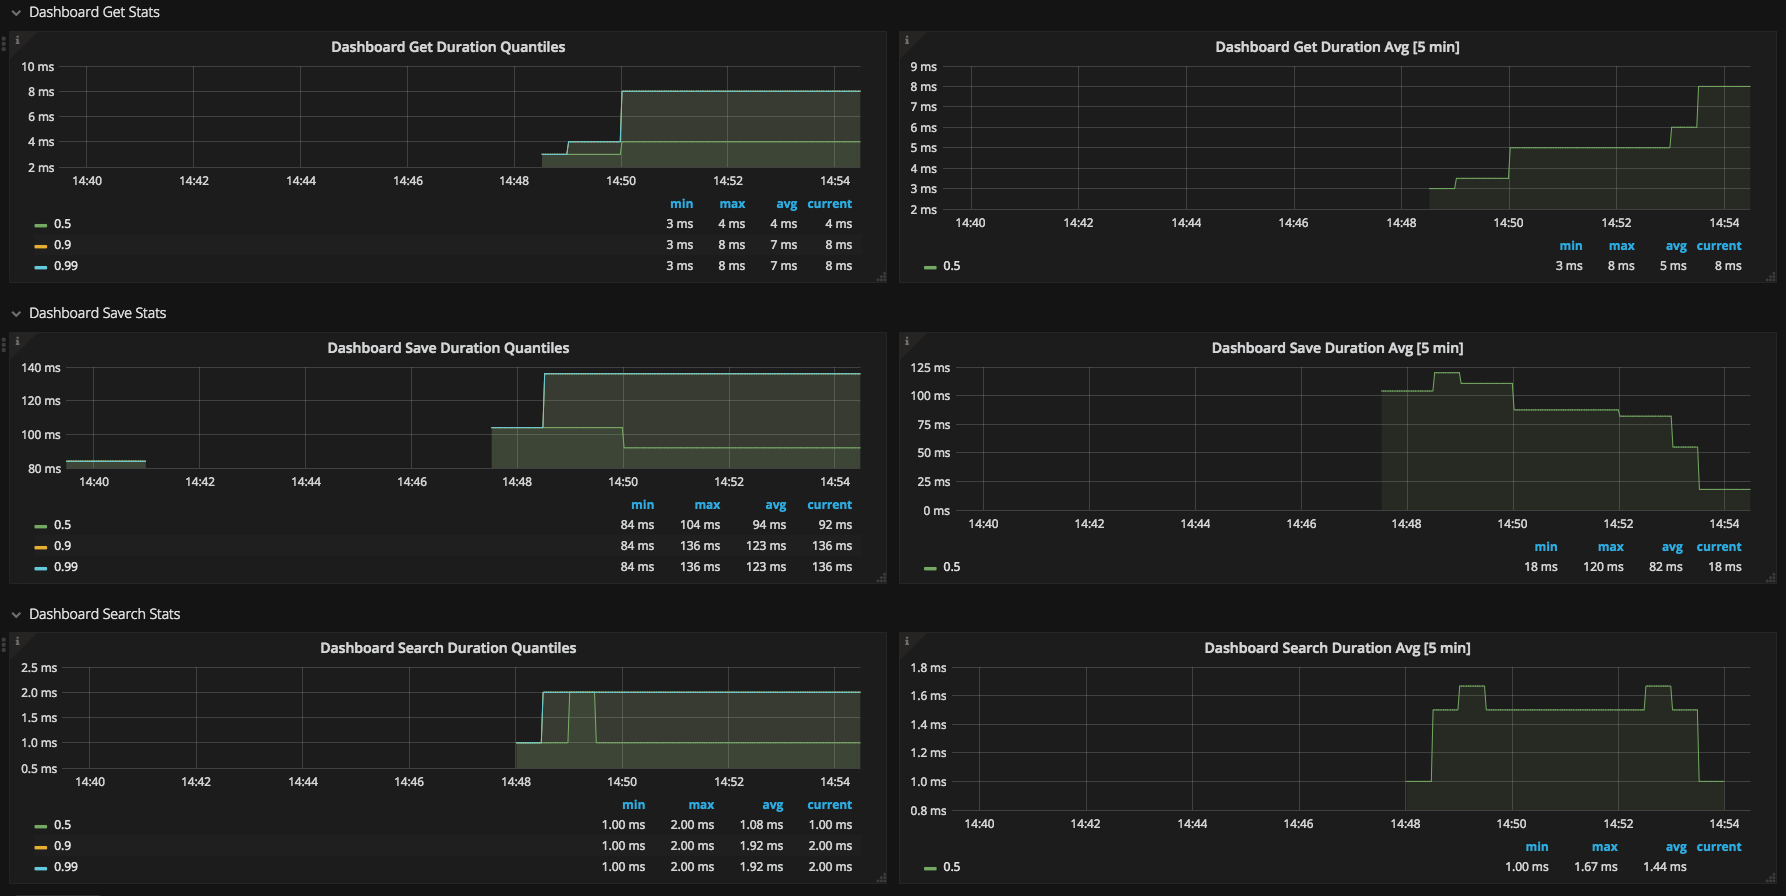
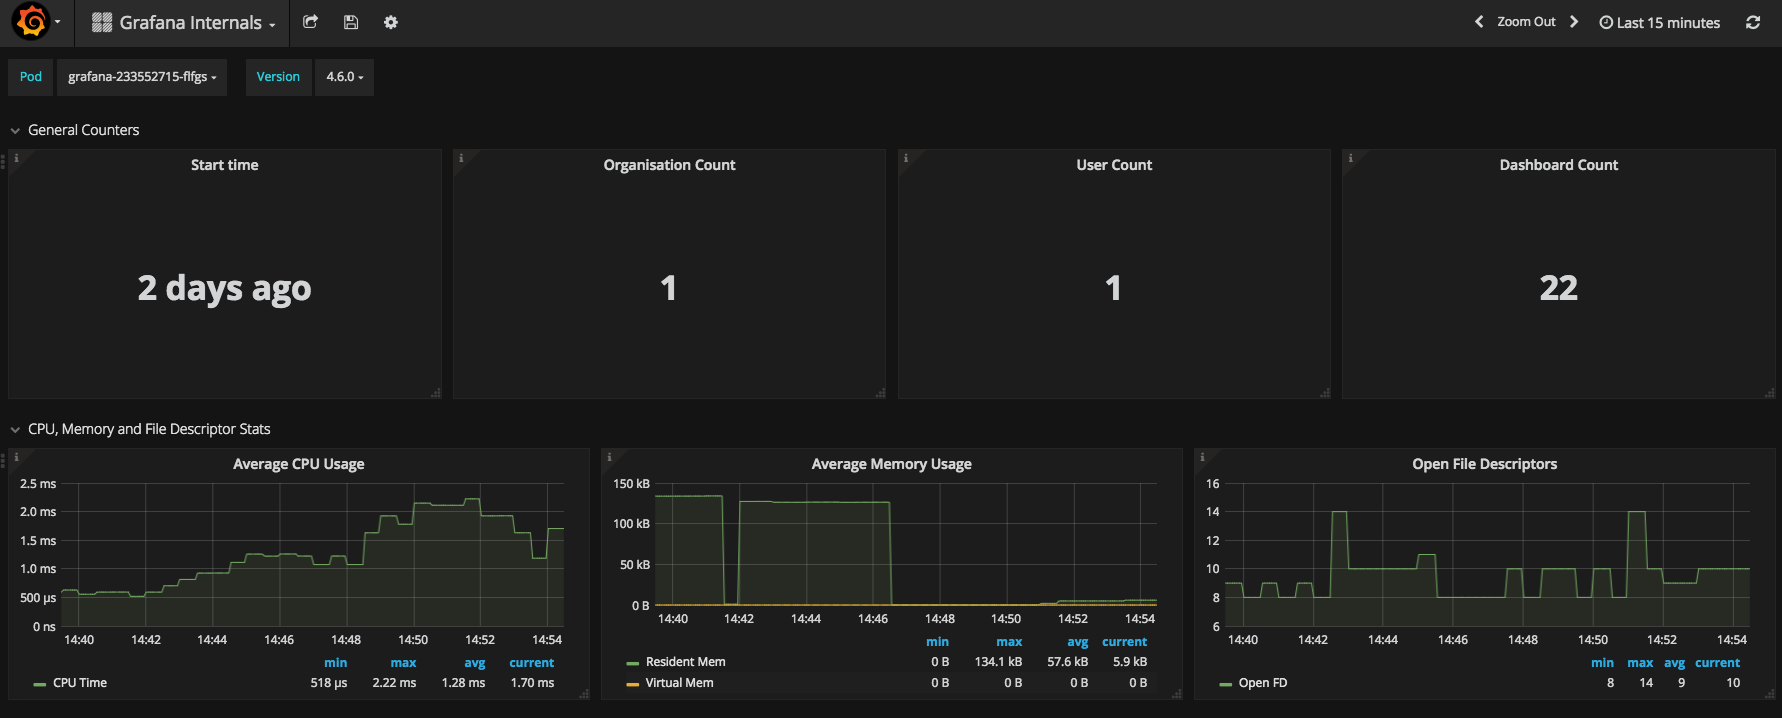
This dashboard monitors core Grafana and Prometheus internals, focusing on how the monitoring stack itself is performing. It highlights the health and performance of critical components such as up, scrape_duration_seconds, and prometheus_tsdb_head_sample_interval, providing visibility into scrape reliability, query responsiveness, and data storage progress. Key features include structured panels for scrubbed health checks, time-based latency trends, and alerts on degradation to help operators diagnose issues without digging into raw telemetry.
Screenshots
Get Dashboard✕
Download
Copy to Clipboard