GoQuorum Overview 1,4361,436
Description
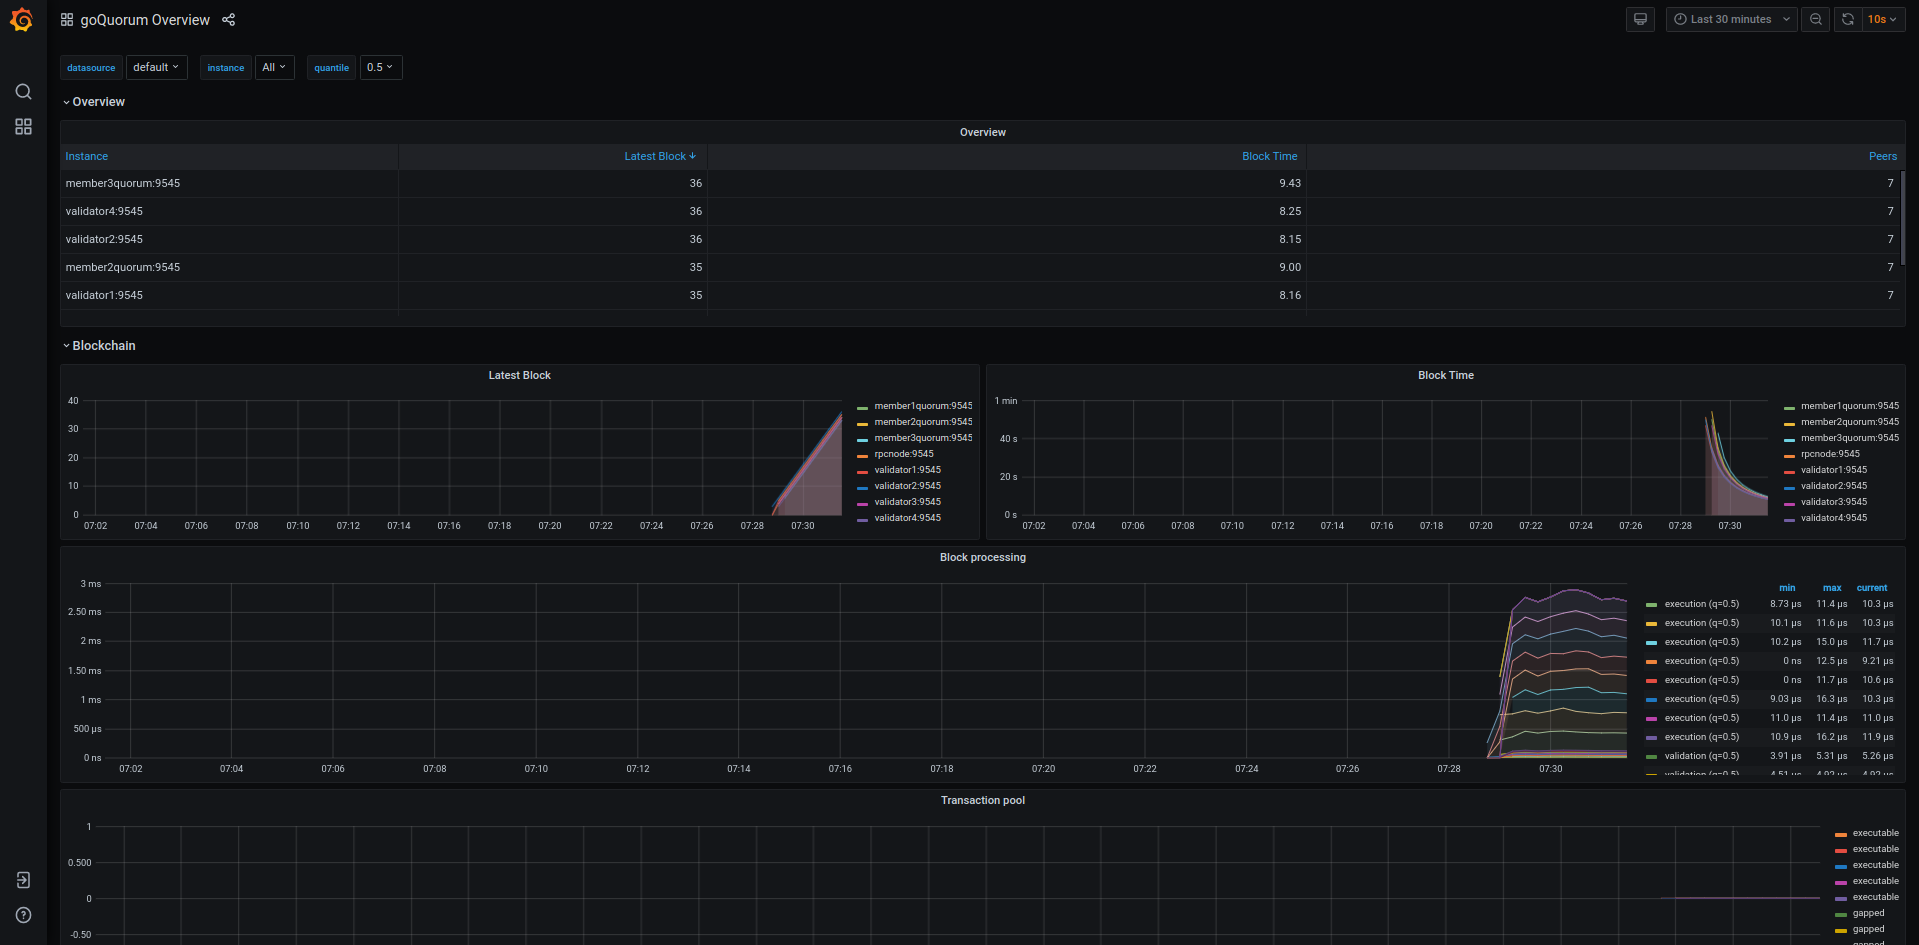
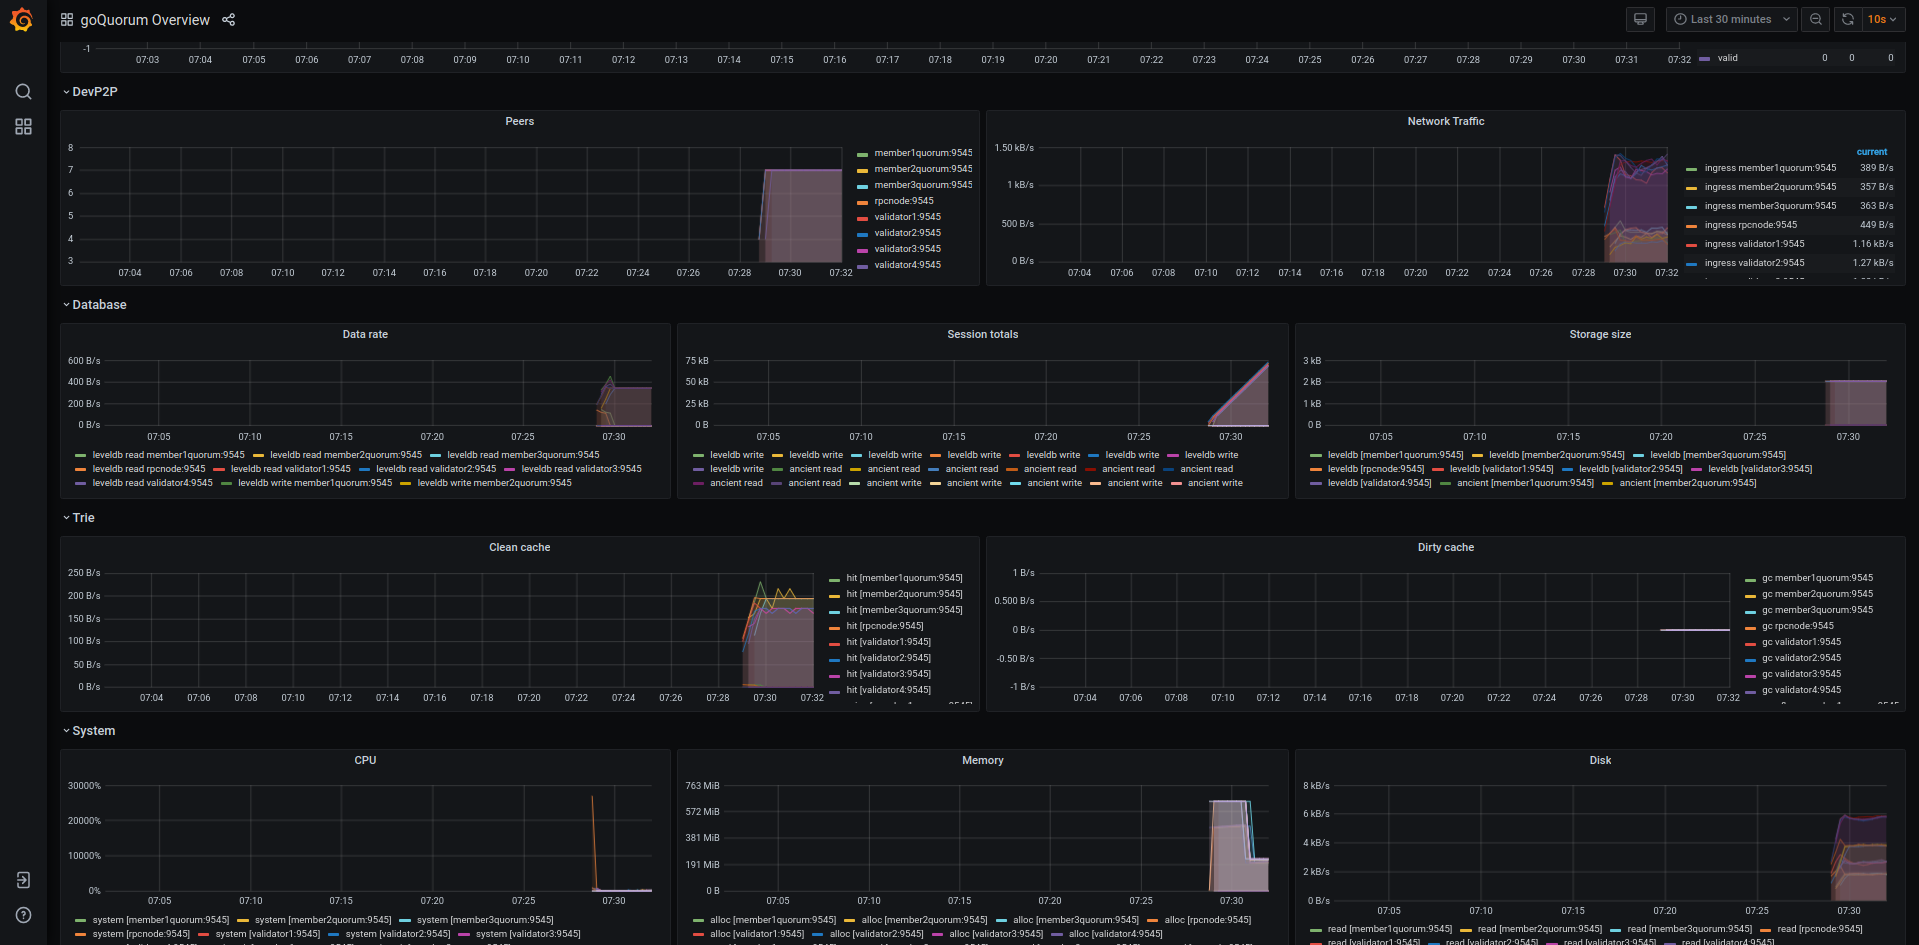
Provides an overview of GoQuorum nodes and networks
Screenshots
Used Metrics 4848
chain_account_commits
chain_account_hashes
chain_account_reads
chain_account_updates
chain_execution
chain_head_block
chain_storage_commits
chain_storage_hashes
chain_storage_reads
chain_storage_updates
chain_validation
chain_write
eth_db_chaindata_ancient_read
eth_db_chaindata_ancient_size
eth_db_chaindata_ancient_write
eth_db_chaindata_disk_read
eth_db_chaindata_disk_size
eth_db_chaindata_disk_write
p2p_egress
p2p_ingress
p2p_peers
system_cpu_procload
system_cpu_sysload
system_cpu_syswait
system_disk_readbytes
system_disk_writebytes
system_memory_allocs
system_memory_held
system_memory_used
trie_memcache_clean_read
trie_memcache_clean_write
trie_memcache_commit_size
trie_memcache_flush_size
trie_memcache_gc_size
txpool_invalid
txpool_local
txpool_pending
txpool_pending_discard
txpool_pending_nofunds
txpool_pending_ratelimit
txpool_pending_replace
txpool_queued
txpool_queued_discard
txpool_queued_nofunds
txpool_queued_ratelimit
txpool_queued_replace
txpool_underpriced
txpool_valid