Go Processes 123,698123,698
7/23/2016
8/14/2016
3
>=3.1.1
Prometheus
Description
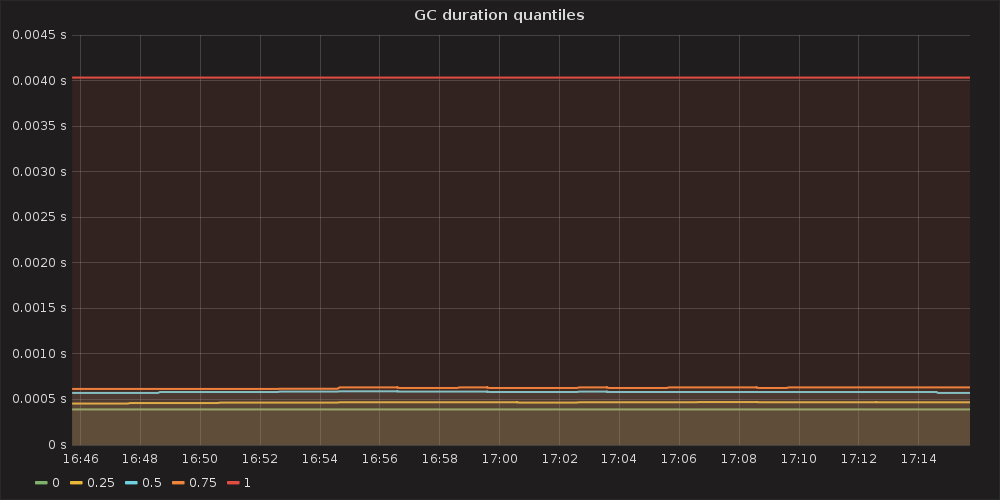
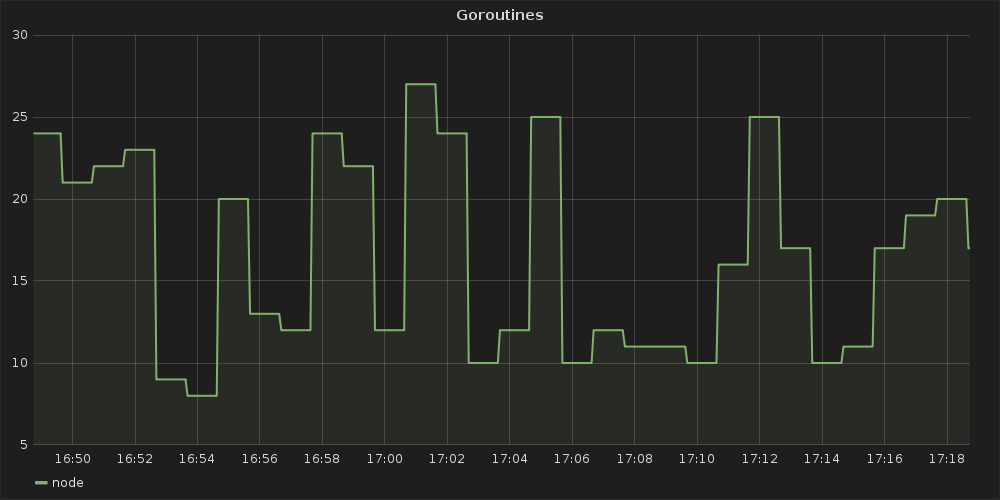
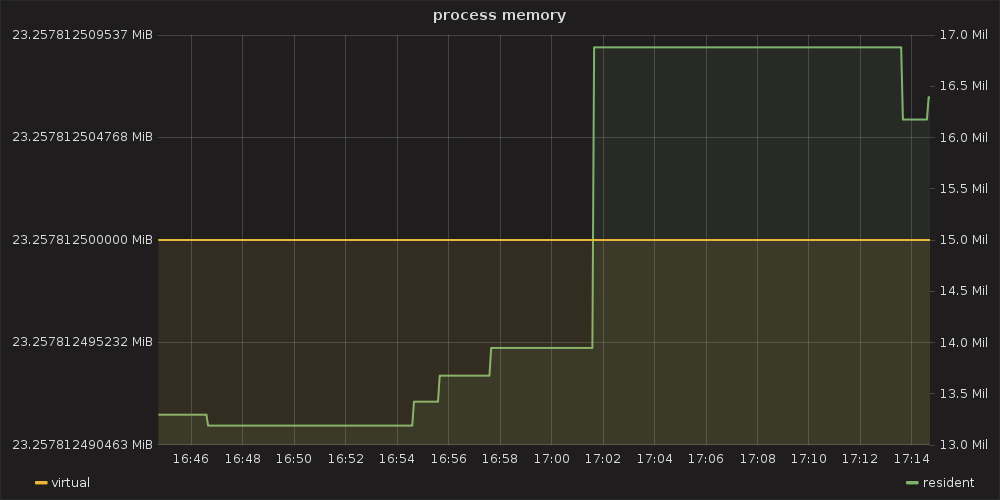
Monitors Go process health and performance by visualizing key runtime metrics over time. It typically highlights goroutines, memory usage, and CPU usage to identify bottlenecks or leaks; panels may include time-series plots and gauges showing current values vs. targets. This setup enables rapid detection of spikes or degradation in Go applications, with concise, actionable dashboards for ongoing reliability and performance tuning.
Screenshots
Get Dashboard✕
Download
Copy to Clipboard