GlusterFS 1,2831,283
10/15/2018
10/19/2018
2
>=5.3.1
Prometheus
Description
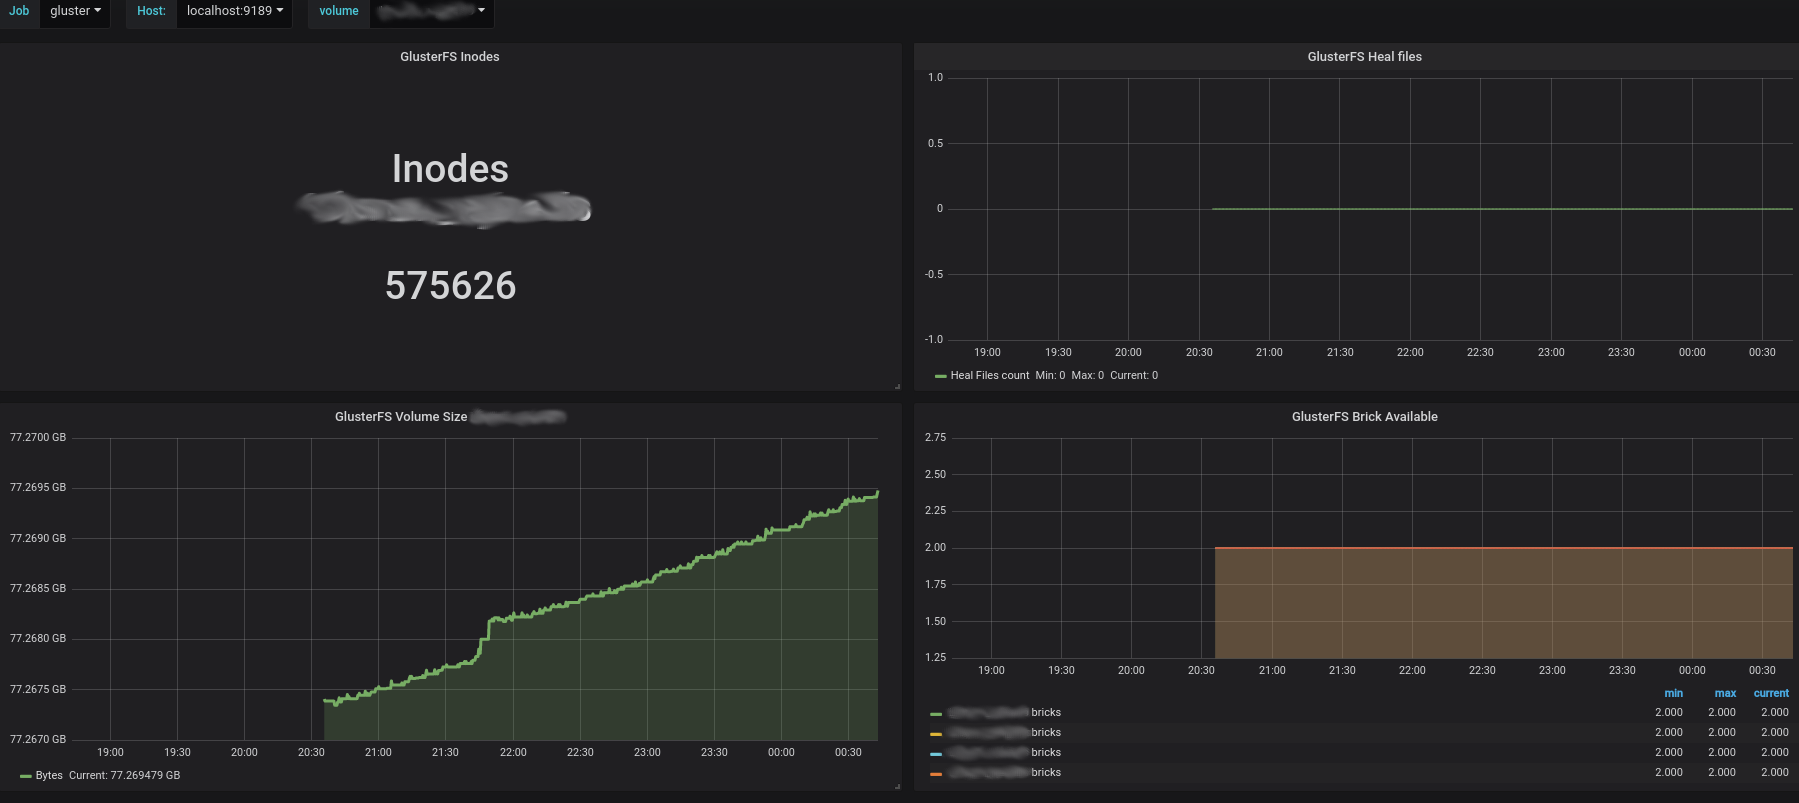
Screenshots
Used Metrics 66
gluster_brick_available
gluster_heal_info_files_count
gluster_node_inodes_free
gluster_node_inodes_total
gluster_node_size_bytes_total
gluster_node_size_free_bytes
Get Dashboard✕
Download
Copy to Clipboard