GitLab Omnibus 157,221157,221
4/24/2018
10/10/2018
4
>=4.6.3
Prometheus
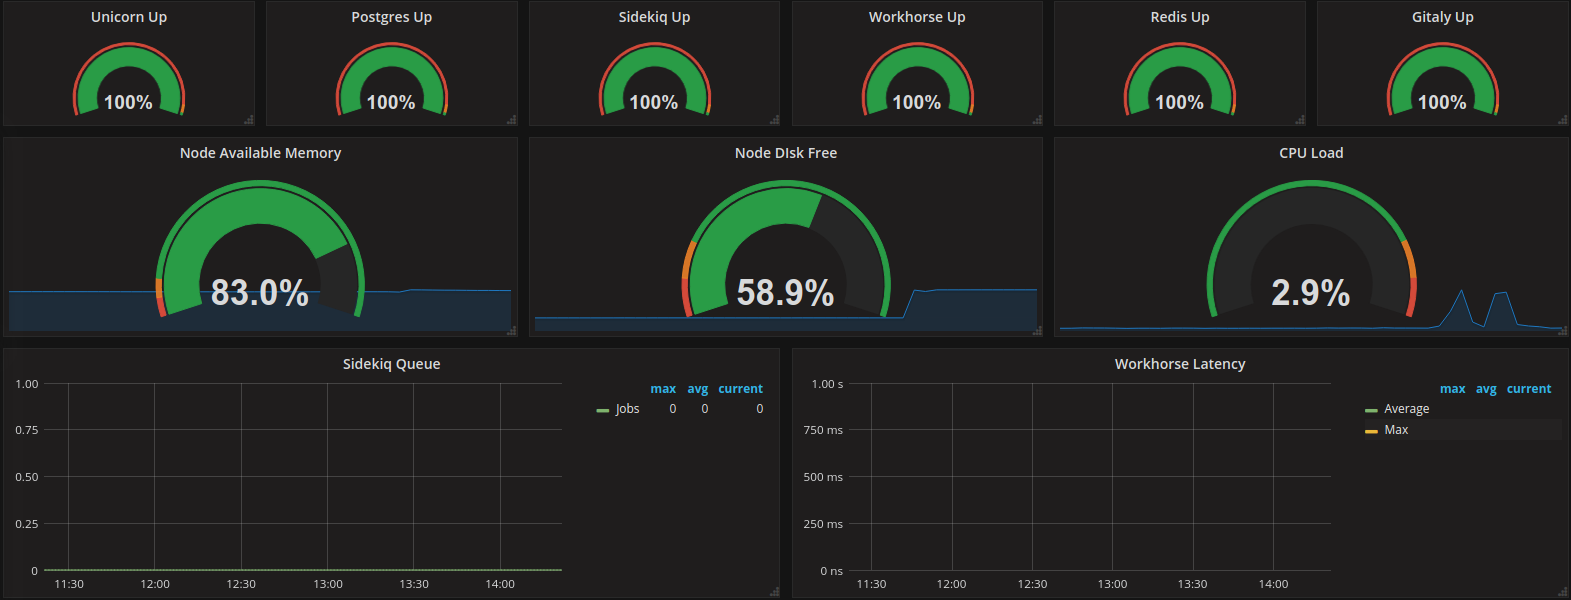
Description
Monitors the health and performance of a GitLab Omnibus deployment by visualizing key Prometheus metrics related to service availability, resource utilization, and process health. Key features include time-series charts for uptime, CPU/memory usage, and GitLab-specific readiness signals, with emphasis on alerting thresholds and drill-down panels for troubleshooting. Metrics such as up{job="gitlab"}, container_cpu_usage_seconds_total, and gitlab_rails_http_request_duration_seconds are commonly used to assess service reliability, resource pressure, and request latency across the stack.
Screenshots
Get Dashboard✕
Download
Copy to Clipboard