GitLab CI pipelines 682,827682,827 4.0 (3 reviews)
7/26/2019
11/4/2020
4
>=7.3.1
Prometheus
Description
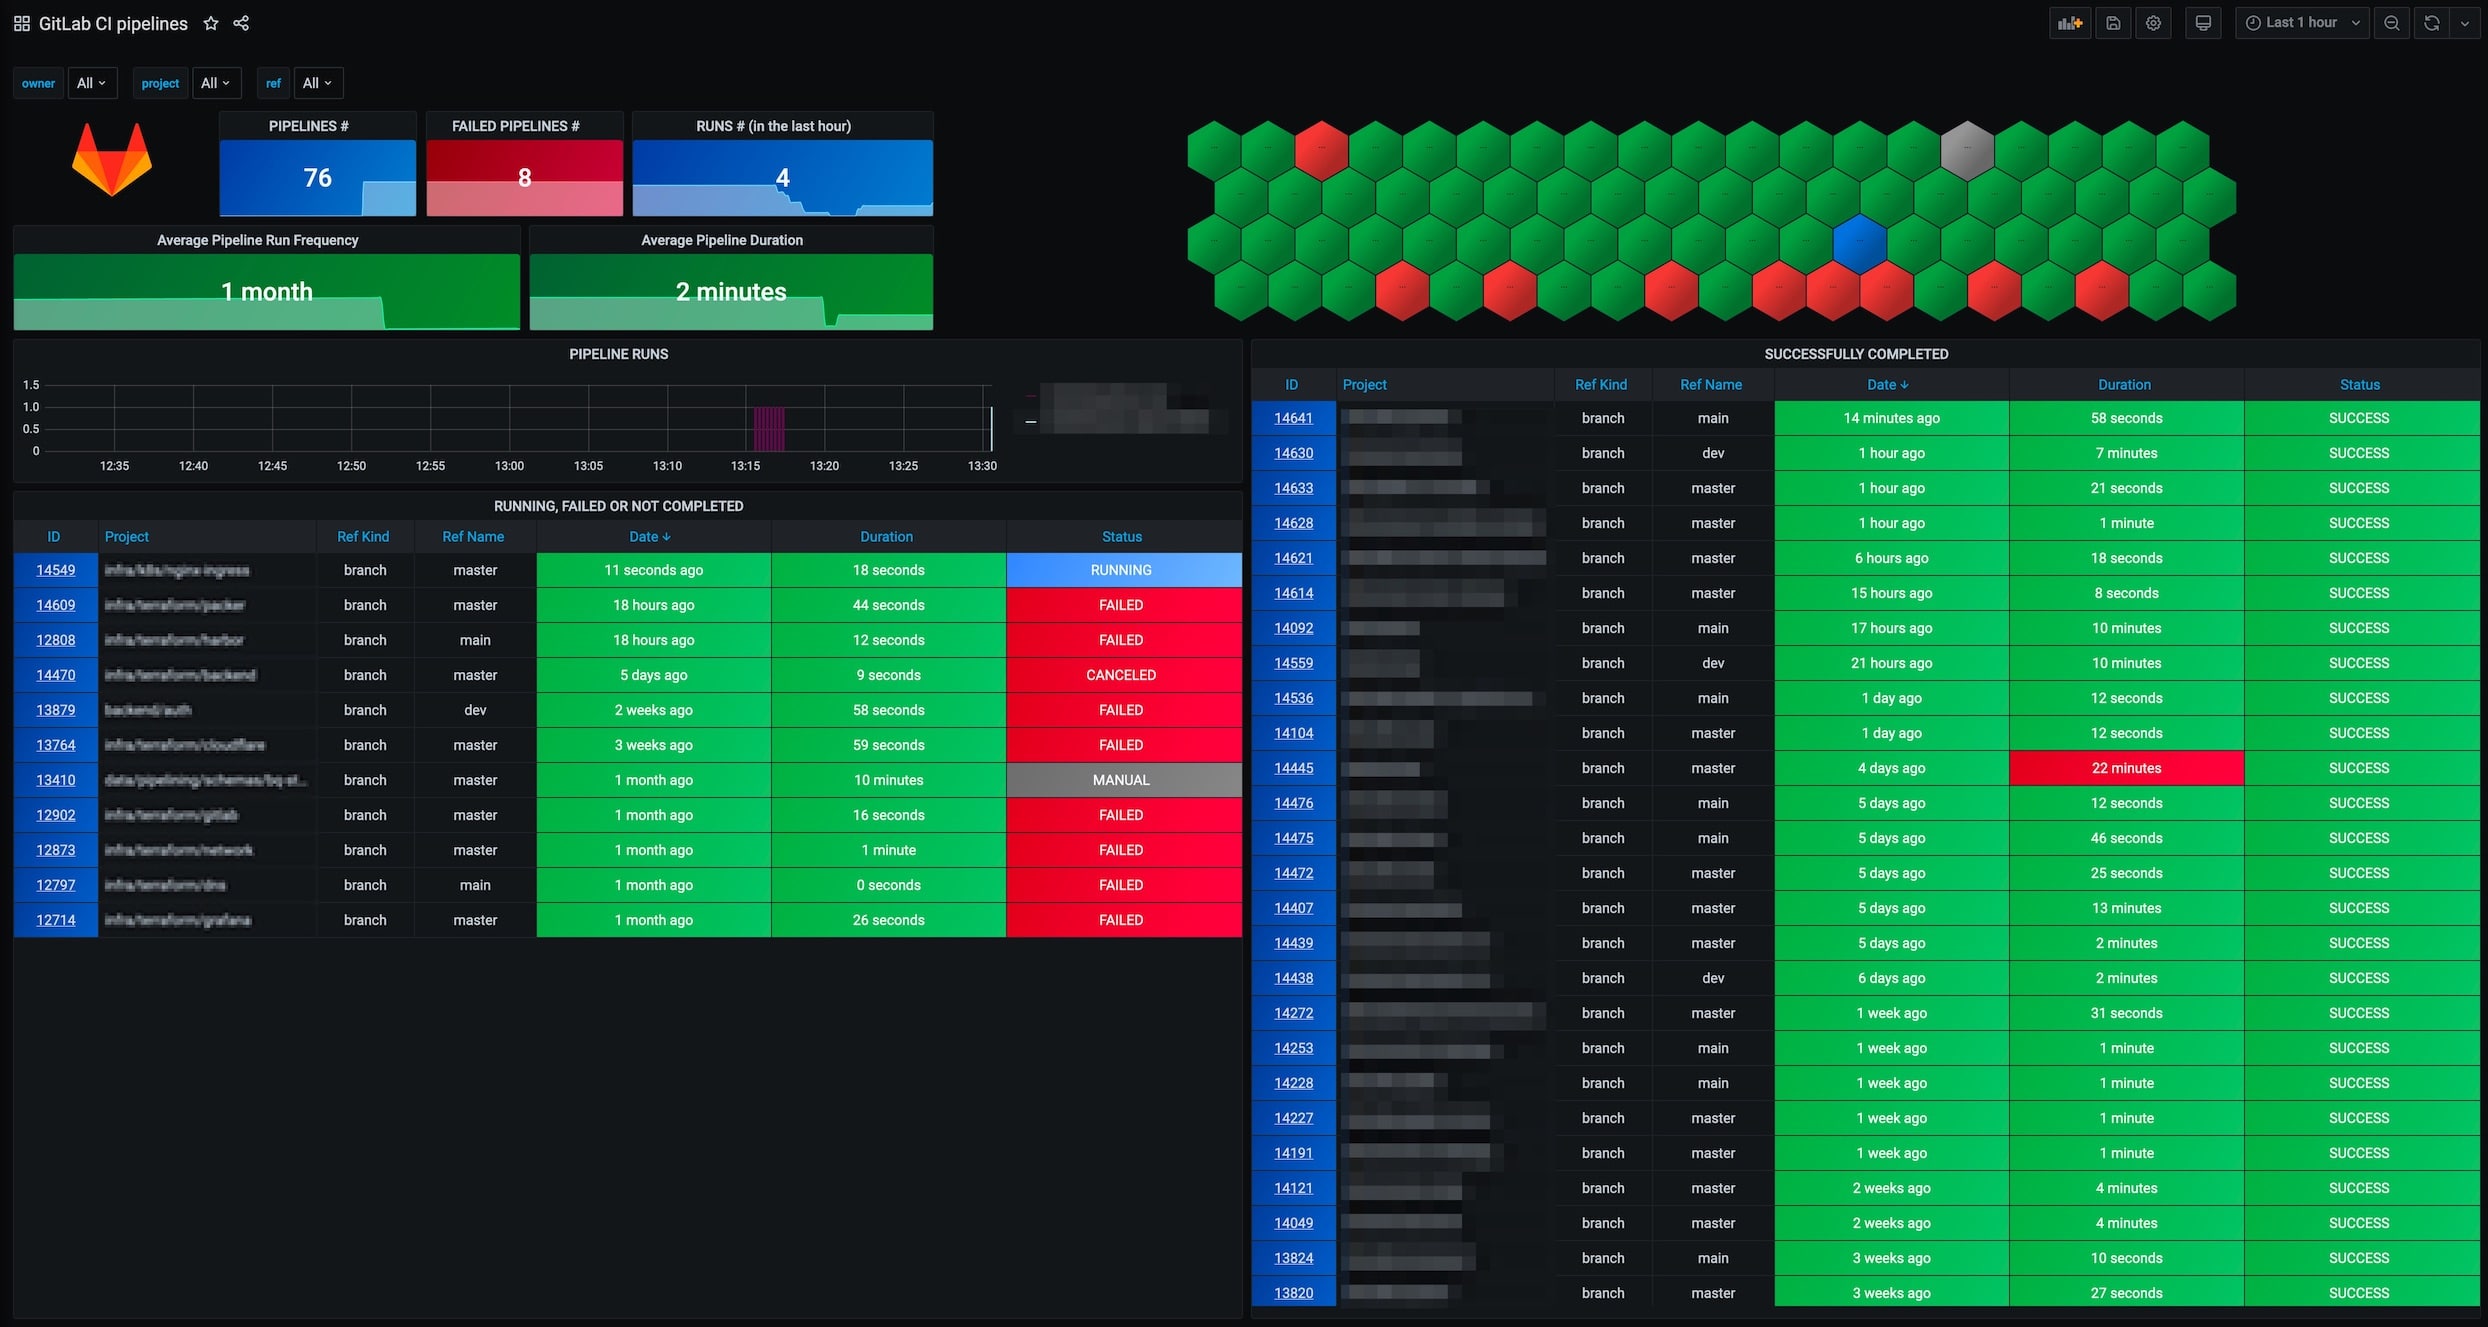
This dashboard tracks GitLab CI pipeline activity with real-time metrics and status breakdowns. It highlights core metrics such as gitlab_ci_pipeline_run_count (total runs), gitlab_ci_pipeline_status (success, failure, and in-progress states), and gitlab_ci_pipeline_duration_seconds (avg/median duration) to surface trends in throughput, reliability, and performance across pipelines. Key features include per-panel visuals for RUNS in the last hour, counts of FAILED PIPELINES, and distributions of pipeline timings to quickly identify bottlenecks and failing trends.
Screenshots
Used Metrics 55
gitlab_ci_pipeline_duration_seconds
gitlab_ci_pipeline_id
gitlab_ci_pipeline_run_count
gitlab_ci_pipeline_status
gitlab_ci_pipeline_timestamp
Get Dashboard✕
Download
Copy to Clipboard